| |
FIG PUBLICATION NO. 48
Rapid Urbanization and Mega Cities:
The Need for Spatial Information Management
Research study by FIG Commission 3
Contents
Foreword
Acknowledgements
Authors
Contributors
Executive Summary
Background to Study
Urbanisation
Problems to be Managed Within Megacities
City Governance
Spatial Information to Manage Megacities
Spatial Data Infrastructures (SDI)
for Megacities
Innovative Uses of Spatial Information Tools to
Manage Megacities
Spatial Information Policy
Constraints
1. Introduction
1.1 Rapid Urbanisation
1.2 The Rise of Megacities
1.3 Problems Identified in Megacities
1.4 The Need for Developing New Spatial Tools
2. Technical Innovation in Management of Spatial
Data
2.1 Current Approaches to Urban Spatial Information Management
2.2 Data Collection Technologies
2.2.1 Photogrammetry
2.2.2 Field Surveying
2.2.3 Cartographic Digitisation and
Scanning
2.2.4 Radar Based Systems
2.2.5 LiDAR
2.3 Data Integration, Processing and Analysis
2.3.1 Data Integration
2.3.2 3D DTM/raster Data Integration
2.3.3 Constructing a Seamless Geospatial
Database
2.3.4 3D City Modelling
2.4 Change Detection
2.4.1 Change Detection Attributes
2.4.2 Change Detection Strategies
2.5 Urban Sensing
2.5.1 Ubiquitous Sensors
2.5.2 Citizen Initiated Sensors
2.5.3 Direct Citizen Contributions
2.5.4 Application in Megacities
3. Spatial Data Infrastructure
3.1 What is SDI?
3.2 Current Use of Spatial Information in Megacity Management
3.3 SDI in the World’s Largest Cities
3.3.1 SDI Application in the African Region
3.3.2 SDI Application in the
Asia-Pacific Region
3.3.3 SDI Application in the European
Region
3.3.4 SDI Application in the
Pan-American Region
3.4 Current Use of Spatial Information in City Administrations
3.5 Empowerment of Citizens Through SDI
4. Added Value of SDI for City Administration
4.1 Solving Problems
4.2 Integrative Effect of SDI
5. Potential Strategies
5.1 Key Tools Needed to Address Problems
5.2 Most Immediate SDI Needs
5.3 City Strategy of Greater Paris, France
6. Conclusions
7. Recommendations
Bibliography
Orders for printed copies
Today there is an ever-increasing demand for the collection,
integration, management and sharing of reliable spatial information, and the
relevant education, experience sharing and development of best practices. This
growing demand is driven by some of the most important changes in society which
in turn are magnified by rapid urbanisation and the conditions of the world’s
megacities. It is the purpose of FIG and its Commission 3 to assist the
profession in all aspects of spatial data management in respond to these
challenges and in support of society everywhere.
During the 2007–2010 term of office FIG Commission 3 has
addressed the phenomenon of rapid urbanization and its impacts. Its particular
focus has been on identifying spatial tools and general principles, norms and
standards for good governance using reliable and accessible spatial information
and providing guidance to interested countries to successfully address the
problem of rapid urbanization. A central theme has been the formal access to
land, property and housing for all. Further research will focus on climate
change and disaster prevention and response, and other security issues that
emerge due to rapid urbanization and accelerated development.
In this effort FIG Commission 3 has developed valuable synergies
to adopt a multisector approach bringing together those people with relevant
expertise including academics, state administrators, decision-makers and the
private sector in the sharing of experience and knowledge. FIG Commission 3 has
cooperated closely with agencies of the United Nations (UN-ECE, WPLA, UN-HABITAT
and GLTN), the World Bank, ISPRS and other sister associations.
FIG Commission 3 aims to contribute to building knowledge and
raising awareness in improving the quality of governance in large urban areas
through the necessary reforms and the use of spatial data infrastructures. This
publication is a further contribution of FIG and FIG Commission 3 in this field.
The recommendations listed in the end of the publication should help government,
decision makers and professionals to deal with the major challenges of rapid
urbanisation.
FIG would like to thank the members of the expert group and all
the specialists who have contributed to this publication for their constructive
and helpful work.
Prof. Stig Enemark
FIG President |
Dr. Chryssy Potsiou
FIG President Chair of FIG Commission 3 |
The following experts and institutions are acknowledged for their valuable
contributions to this study:
- Prof Dr Yerach DOYTSHER, Dean of the Faculty of Architecture and Town
Planning, Technion Israel Institute of Technology, vice chair of FIG Com3,
Israel
- Paul KELLY, Director, Spatial Strategies Pty Ltd, chair of FIG WG 3.2,
Australia
- Rafic KHOURI, Senior International Relations Officer, Ordre des
Géomètres Experts, France
- Robin McLAREN, Director of Independent GIS Consulting Company KNOW EDGE
LTD, United Kingdom
- Prof Dr Hartmut MUELLER, Mainz University of Applied Sciences, co-chair
of FIG WG 3.2, Germany
- Dr Chryssy A POTSIOU, lecturer at the School of Rural and Surveying
Engineering of the National Technical University of Athens, delegate of
Technical Chamber of Greece, chair of FIG Commission 3, Greece
*Authors’ names are listed in alphabetical order
Special thanks go to the correspondents in the seven megacities used as case
studies, to Prof Rahmi Nurhan CELIK, Istanbul Technical University, and Anthony
ADEOYE, Lagos city administrator for their contribution in data collection and
to Gerasimos APOSTOLATOS, FIG Com3 vice chair of Administration. The support of
all FIG Commission 3 delegates who have participated and prepared coordinated
research papers in the three annual workshops is gratefully acknowledged.
We also thank the Technical Chamber of Greece for its continous four-year
support of FIG Commission 3 relevant activities and for hosting the annual 2007
Comission 3 Workshop; the Spanish Association of Surveyors and DVW German
Association of Geodesy, Geoinformation and Land Management for hosting the
annual Commission 3 workshops; and the French Order of Surveyors for hosting the
final expert group meeting in Paris.
Special thanks to Prof Stig ENEMARK, President of FIG, for providing
strategic guidance in identifying urbanisation as a key global issue in
supporting the Millennium Development Goals.
Disclaimer
Note that the following report is based partly upon data received from
questionnaires and interviews involving individual people in city
administrations. Therefore, the data reported here may not represent the broader
view of other stakeholders and cannot be seen as an official statement of fact
from any city administration. The data is further subject to interpretation by
the authors and, while based on the data provided by correspondents, any views
expressed within this report are those of the authors of this report.
The International Federation of Surveyors (FIG) is an international,
non-government organisation whose purpose is to support international
collaboration for the progress of surveying in all fields and applications. FIG
Commission 3 (Spatial Information Management) has undertaken a research study
about trends in the use of spatial information and technology in supporting the
management of eight of the world’s largest cities.
The research has included:
- Management of spatial information about land, property and marine data;
- Spatial Data Infrastructure, including policy, institutional and
technical frameworks;
- Management and transfer of knowledge and skills in using spatial
information;
- Impacts on organisational structure, business models and public-private
partnerships; and
- Spatial information management in the support of good city governance.
Urbanisation is a major change taking place globally. The urban global
tipping point was reached in 2007 when for the first time in history over half
of the world’s population 3.3 billion people were living in urban areas. It is
estimated that a further 500 million people will be urbanised in the next five
years and projections indicate that 60% of the world’s population will be
urbanised by 2030.
This rush to the cities, caused in part by the attraction of opportunities
for wealth generation and economic development, has created the phenomenon of
’megacities’: urban areas with a population of 10 million or more. There are
currently 19 megacities in the world and there are expected to be 27 by 2020.
Over half of this growth will be in Asia where the world’s economic geography is
now shifting.
This incredibly rapid growth of megacities causes severe ecological,
economical and social problems. It is increasingly difficult to manage this
growth in a sustainable way. It is recognised that over 70% of the growth
currently takes place outside the formal planning process and that 30% of urban
populations in developing countries are living in slums or informal settlements,
i.e. where vacant state-owned or private land is occupied illegally and is used
for illegal slum housing. In sub-Saharan Africa, 90% of new urban settlements
are taking the form of slums. These are especially vulnerable to climate change
impacts as they are usually built on hazardous sites in high-risk locations.
Even in developed countries unplanned or informal urban development is a major
issue.
Urbanisation is also contributing significantly to climate change. The 20
largest cities consume 80% of the world’s energy and urban areas generate 80% of
greenhouse gas emissions worldwide. Cities are where climate change measures
will either succeed or fail.
Rapid urbanisation is presenting the greatest test for land professionals in
the application of land governance to support and achieve the Millennium
Development Goals (MDGs). The challenge is to deal with the social, economic and
environment consequences of this development through more effective and
comprehensive land administration functions, supported by effective Spatial Data
Infrastructures, resolving issues such as climate change, insecurity, energy
scarcity, environmental pollution, infrastructure chaos and extreme poverty.
Problems to be Managed Within Megacities
Administrations in large cities are often confronted with a multitude of key
problems, like high urban densities, transport, traffic congestion, energy
inadequacy, unplanned development and lack of basic services, illegal
construction both within the city and in the periphery, informal real estate
markets, creation of slums, poor natural hazards management in overpopulated
areas, crime, water, soil and air pollution leading to environmental
degradation, climate change and poor governance arrangements.
The inevitability of further population growth is a common issue. Some cities
reported that their administrations have little control over population growth;
it was a regional or national issue and must be addressed at that level.
However, monitoring population change effectively and being able to respond
through planning and infrastructure development will be major challenges.
Informal settlements are a problem in many cities. An increasing number of
citizens do not have either permanent or temporary access to land and adequate
shelter. This exclusion is caused, in many cases, by structural social
inequalities, inheritance constraints, conflicts, non pro-poor or pro-gender
land policies and land administration systems that are ineffective and expensive
for the end user. Without a range of appropriate interventions being applied
within the broader context of economic growth and poverty reduction policies,
social exclusion and poverty will continue to spiral out of control; already 90%
of new settlements in sub-Sahara Africa are slums.
Natural hazards and emergency management are major issues in most cities.
Risk profiles from floods, fires, earthquakes and other hazards differ among
cities, but capacity to plan, prepare, respond and recover from disasters is a
common need.
Many cities appear to have problems with unclear and overlapping
responsibilities amongst internal and external agencies, leading to operational
dysfunction such as a multitude of agencies holding non-accessible spatial
information. For example, Sao Paulo comprises component cities all with their
own governance arrangements. It is clear that solutions to problems facing
megacities require concerted response from many internal units and regional and
national agencies in areas such as planning, infrastructure, development and
land use controls, transportation, environmental management and water
management. Mandates might be clear, but rationalisation of functions and more
effective levels of cooperation and information sharing are needed.
Even if city planning is centrally coordinated, city administrations often
have little control over the implementation (i.e. land use and building
controls) of their policiesand plans. For example, in France the greater Paris
region, Île de France, has a regional planning authority that sets planning
policies for the highly decentralised 1,280 communes. Political differences
create tensions in the consistent implementation of these planning policies.
The influence of megacities reaches well outside their administrative
boundaries to the peri-urban and regions beyond. It is essential that the
greater region be managed holistically to maximise the economic benefits of the
city. Regional planning places even greater emphasis on effective governance of
the larger region, even across international boundaries, with cooperation in
planning, development control and sharing information being essential.
In many cases, infrastructure providers are not a direct part of the city
administration’s planning and development process, some are private enterprises
while others may be located at another level of government. This causes problems
with the proactive planning and strengthening of utility services.
Most megacities support some level of civil society participation in the
planning and design of their services, such as citizen involvement in the urban
planning process. However, spatially enabled web based services are providing
new opportunities to more closely involve citizens in consultations and land
administration functions.
The rapid growth of megacities causes severe social, economical ecological
and problems. How can this growth be nurtured in a sustainable way? The
challenge for land professionals is to provide the megacity ‘managers’, both
political and professional, with appropriate ‘actionable intelligence’ that is
up-to-date, citywide and in a timely manner to support more proactive decision
making that encourages more effective sustainable development.
Spatial information has become indispensable for numerous aspects of urban
development, planning and management. The increasing importance of spatial
information has been due to recent strides in spatial information capture
(especially satellite remote sensing and positioning), management (utilising
geographic information systems and database tools) and access (witness the
growth in web mapping services), as well as the development of analytical
techniques such as high resolution mapping of urban environments. These more
efficient techniques can lead to a wider diversity of information that is more
up-to-date.
In some circumstances, a wealth of existing map, image and measurement data
can already be found in areas such as land administration, natural resource
management, marine administration, transportation, defence, communications,
utility services and statistical collections. The challenge is for users both
within and outside these areas of activity to break down the information silos
and to discover, to access and to use the shared information to improve
decision-making, business outcomes and customer services.
The study has found that spatial information technology is being recognised
widely as one of the tools needed to understand and address the big urban
problems, but there is still a general lack of knowledge amongst communities of
practice about what spatial solutions exist and how they can used and
prioritised.
Information to support the management of cities is traditionally channelled
and aggregated up the vertical information highway from a local, operational
level to a policy level. In developed countries, urban growth and its
characteristics can normally be measured through information derived from the
land administration functions. However, in the megacities of the developing
countries, informal settlements are the norm, growth is rampant and
administrative structures are limited. The traditional source of change
information is not readily available there.
The concept of using SDI to more efficiently manage, access and use spatial
information across megacities is evolving and megacities are at different stages
of their implementation. The EC INSPIRE Directive has provided welcome impetus
across Europe and beyond. However, most cities have no strategic framework to
guide and create their SDI. This reflects the difficulty of the task to create
an SDI within megacities that are organisationally complex and involve a large
number of stakeholders with diverse sets of spatial information; a microcosm of
the national problem.
City administrations have different interpretations of what constitutes an
SDI, but most reported that they had at least some elements of an SDI already in
place. Cities like Paris and New York have a more mature and comprehensive
implementation of a megacity SDI, managed by dedicated resources. However, most
cities reported that they had only small “central GIS units”, under-resourced
and generally incapable of providing a comprehensive citywide SDI. Missing
capabilities included no spatial data policies and standards, common metadata,
formal data sharing arrangements between units or agencies, or shared data
access mechanisms. It could be many years before mature and fully populated SDI
emerge in megacities. However, it is important for megacities, especially in
developing countries, to develop SDI capabilities in areas that will deliver the
most benefits to their current pressing needs.
Most do not have a formal “spatial information strategy” across the whole
administration. However, most countries covered by this project have national
(and in some cases regional) SDI strategies. At this stage it is not clear what
connection there is between national and local strategies or how national
strategies will meet the needs of cities.
Some cities, for example New York, have developed an intranet that could be
used to access spatial data held across multiple units. Other cities, such as
Buenos Aires, have invested in providing access to spatial data as part of their
public websites, reporting information about aspects of city administration such
as land tenure, use, planning, environmental and disaster management
information. Approaches like these should be used as exemplars by other cities.
Although Norway does not have megacities, the Norwegian SDI provides a model
for an application of spatial data infrastructure in a democratic society
enabling citizen participation in policy and decision-making for city
management.
Innovative Uses of Spatial
Information Tools to Manage Megacities
New tools, techniques and policies are required to baseline and integrate the
social, economic and environmental factors associated with megacities, to
monitor growth and change across the megacity and to forecast areas of risk –
all within shorter timeframes than previously accepted. Moreover, they must be
flexible enough to meet traditional needs such as land development, tenure and
value applications, but be designed to be interoperable and integrate within the
city wide SDI as it evolves. Access to integrated spatial information from the
SDI will lead to more joined-up, proactive decision making allowing the
prioritising of scarce resources to tackle the most sensitive and risk prone
areas within a megacity.
These tools must support the operation of land administration functions, but
should also support the management of key problems such as disaster management,
flooding control, environmental management, health and transportation, for
example, but also encourage economic development and reduce social inequalities.
These spatial information tools include:
- Data collection & maintenance – high resolution satellite imagery (<
0.5m) is now commercially available at an affordable rate from a number of
sources with repeat coverage at a frequency greater than required for this
application. This opens up the possibility to efficiently generate
topographic and thematic mapping (at a scale of at least 1:5,000) and to
better understand changes across the city, such as sporadic creation of
informal settlements.
- Data integration and access – international interoperable information
and services standards allow the possibility of the real-time merging of
data and services (plug and play) from a variety of sources across the city.
This will be achieved through the creation of shared, web information
services to allow users access to the wide range of information held by
different agencies across the city. This will be instrumental in breaking
down information silos and will lead to the innovative re-use of spatial
information.
- Data analysis – data mining and knowledge discovery techniques allow the
integration of a wide range of spatial information and associated attribute
information. This creates the opportunity to perform more effective forms of
analysis and decision-making, leading to more cost effective solutions such
as targeting of limited city resources for health care and maximising the
economic benefits of investments in transportation.
- 3-D city modelling – many applications are enhanced by the use of 3-D
spatial information, such as visualisation of planning development
proposals, flood predictions, modelling population growth, tourist visit
simulations and the design of transportation networks. 3-D spatial
information of the natural and built environments is increasingly available,
e.g. through LiDAR and terrestrial laser scanning, making many of these
applications operationally viable.
- Citizen centric urban sensing – The new generation of urban sensors,
including cellular phones, has potential for providing managers with access
to a range of current spatial and environmental information about the
evolving activities of their megacities. By these means people could
voluntarily provide information about changes to their environment. This
has the potential to increase the levels of citizen participation in the
governance of megacities and to help to fill the current gaps in urban
information needed to understand the dynamics of megacities. At the national
level, no country has so far generated data management policies that truly
integrate and utilise this new approach. Citizen participation in data
collection must be voluntary and data collection methods must be transparent
and open to public understanding.
Advances in developing megacity SDI will only occur when senior management
are convinced of the benefits through experience derived from business case
studies and only when SDI implementation is guided by a supportive megacity
information strategy. However, it is difficult to achieve this type of strategy
in the complex multi-layer governance structures of the megacities.
As spatial information is used more commonly with more citizen awareness,
there is a risk of popular mistrust concerning privacy issues. It is therefore
essential that policy frameworks are established legally for the appropriate use
of spatial information. It is also important to raise public awareness about the
benefits citizens will enjoy through SDI, mainly due to increased transparency
in city governance; and the opportunity for public participation in
decision-making.
It must be recognised that citizen participation in information gathering
suggests certain risks like the concern for privacy; suspicion of governmental
intrusion and loss of public support; the issue of quality of data collected by
non professionals and the need for quality analysis; the danger of miss-use of
citizen-provided information by repressive governments; and the question of the
capacity of governmental agencies to monitor, evaluate, and interpret the
volumes of data collected in certain urban sensing systems.
1. Introduction
FIG Commission 3 (Spatial Information Management- SIM) is a permanent
committee of FIG with a focus on:
- Management of spatial information about land, property and marine data
(data, tools, methods, policies, processes, procedures)
- Spatial data Infrastructure – data collection, analysis, visualization,
standardization, and dissemination (technical, organizational, personnel,
administrative, financial, policy and legal aspects)
- Management and transfer of knowledge and skills for SIM (educational,
professional development and capacity building aspects)
- Impacts on organizational structure, business models, professional
practice and administration
- Management of spatial information supporting good governance
(sustainable development, social and economic growth and poverty reduction,
environmental protection, democracy, freedom, participation in decision
making, social security).
The Commission 3 work plan for 2006–2010 focused on current trends in
spatial information and technology to improve management of rapidly increasing
urban areas.
The 2006–2010 accomplishments of FIG Commission 3 include, among others:
- The research produced by the three working groups
http://www.fig.net/commission3/wgroups/wg_07_10.htm:
WG 3.1 e- Government and e-Citizen
WG 3.2 Spatial Data Infrastructure
WG 3.3 Multi Dimensional Aspects in Spatial Information Management
- The organisation of three focused joint workshops in cooperation with
other sister organisations
In 2007, on legal and social aspects related to the formalisation of
unplanned and informal urban development
http://www.fig.net/news/news_2007/wpla_march_2007.htm
The output of this joint FIG Com 3 / UNECE research on informal development
was improved and published by UNECE:
http://www.unece.org/publications/oes/SelfMadeCities.pdf
In 2008, on environmental aspects related to rapid urbanisation
http://www.fig.net/news/news_2008/valencia_february_2008.htm
In 2008, on aspects related to methods and tools for data collection,
management and dissemination of spatial information for the management of
sustainable urban areas (economic, social, legal/regulatory, and
environmental aspects)
http://www.fig.net/news/news_2009/mainz_february_2009.htm
This current research study is responsive to the aims of the Commission 3
work plan and is a further contribution in this direction. It investigates the
current trends in using spatial information in particular for the management
of megacities, where needs are enlarged and urgent.
Location, in the form of spatial data, is a key enabler to visualise current
situations, predict impacts and enhance service delivery. Information about
location is a natural integrator, capable of enabling complex analysis of
spatial distribution of places, events and services; providing opportunities to
link up government services, interact with customers and optimise delivery
options.
The value of spatial (location-referenced) data is growing in recognition
internationally. Many countries with developed economies now have policies and
strategies aimed at maximising the benefit from spatial data held by government
agencies in particular. A wealth of existing map, image and measurement data can
already be found in areas such as land administration, natural resource
management, marine administration, transportation, defence, communications,
utility services and statistical collections. The challenge is for users, both
within and outside these areas of activity, to discover, access, and use this
information to improve decision-making, business outcomes and
customer services.
As cities get larger spatial information is becoming a key resource in
efficient delivery of e-government services, public safety, national security
and asset management. In this study, it is proposed that a city-wide spatial
data infrastructure linked to similar structures in other levels of government,
can provide a sustainable solution to many problems of megacities. Despite all
the progress made in spatial data collection, modelling and dissemination, it is
important to look for ways and methods to improve e-government taking into
account the needs of citizens.
The goal of this research is to investigate the emerging needs, the current
trends and the extent of using SDIs in selected megacities, but also to identify
the emerging possibilities for using new technical tools for the governance of
sustainable large urban areas applied by the surveying- mapping- data processing
community. The study aims to demonstrate these technical tools, not only to
governmental policy makers, but also to planners, economists, scientists,
environmentalists, sociologists and all others with an interest in the life of
megacities.
However, it should be mentioned that each city should build its own spatial
data infrastructure, and should choose its own tools appropriate to its own
social, economic and cultural environment. The publication suggests alternative
ways to meet the current requirements and makes general recommendations on best
practice. It does not advocate the use of any specific tools because each
country has a different history and experience.
The methodology followed for this study includes:
- Identification of experience gained through the general current FIG Com
3 activity to improve management of expanding urban areas.
- Review of existing publications and other sources.
- Internet research on specific problems of megacities and on existing
SDIs.
- On site visits to a selected number of megacities and interviews with
individual decision makers in city administrations.
- Review and assessment of data received from questionnaires.
1.1 Rapid Urbanisation
The 20th century is related to the phenomenon of rapid urbanisation. By 1900
13% of the world’s population was urban. During the next years, improvements in
medicine and science allowed higher city densities. According to UN reports, the
urban population increased from 220 million in 1900 to 732 million in 1950 (29%
of the world’s population). By 2007 50% of the world population were living in
cities (Figure 1); further improvements in technology, medicine and prevention
of disease allowed even larger urban densities. According to latest predictions,
4.9 billion people, or 60% of the world’s population, are expected to be urban
dwellers by 2030 (Table 1). Investigations show significant differences in urban
population change between the more developed regions and the less developed
regions. The majority of the inhabitants of the less developed regions still
live in rural areas, but in the more developed regions the population is already
highly urbanized. As urbanisation tends to rise and as development increases
urbanisation is expected to rise as well in the future (Table 2). However,
despite their lower levels of urbanisation, less developed regions have more
than double the numbers of urban dwellers than the more developed (2.3 billion
vs. 0.9 billion). By 1968, the urban population of the less developed regions
surpassed for the first time that of the more developed regions and continues to
do so thereafter. Furthermore, according to UN predictions, the rapid growth of
the population of the less developed regions combined with the near stagnation
of the population in the more developed regions implies that the gap in the
number of urban dwellers between the two will continue to increase (Table 2).
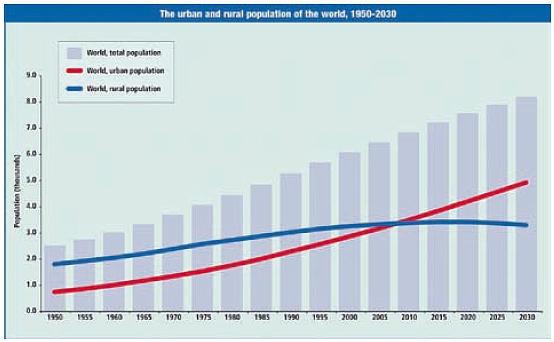
Figure 1: The urban and rural population of the world. (Source: UN
Population Division)
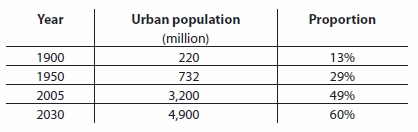
Table 1. Global proportion of the urban population increase. (Source: UN
Population Division)
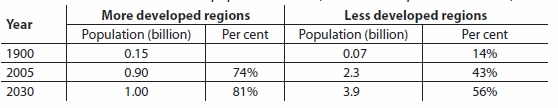
Table 2. Differences in urban population rates. (Source: UN Population
Division)
As some cities developed through the centuries, they became known for their
specific attributes. By example, in the classical era Delphi, Delos, Epidauros
and later Rome, Jerusalem and Mecca became known as religious centres,
Alexandria became known for its library, Constantinople as the capital of the
Byzantine Empire, Damascus for the trade centre and Beijing for its
administration. In modern days culture and markets have become more important
factors; visitors, but also investors and large international corporations, are
attracted by the largest cities worldwide for the museums, exhibitions, cultural
events, fashion, theatres and art galleries. Cities are the centres of learning,
innovation and sophistication. Already during the Byzantine era, Constantinople
had a population of 500,000 citizens (6th–7th century AD) and was considered to
be the second largest city after Baghdad. Today, the same city, Istanbul, has
become a modern megacity of approximately 11 million citizens connecting Europe
with Asia. It is obvious that the location and topography of the area, together
with other major factors like economy have played a major role for the progress
and advancement of several cities through centuries.
However, as cities expand beyond their administrative boundaries they lack
the financial or jurisdictional capacity to provide the necessary services
(planning, water, electricity, sanitation, etc) to all inhabitants. The
administration of the city becomes more complicated and bureaucratic in the less
developed countries, where land administration is weak and new technology and
necessary spatial tools are not implemented.
In the following a few examples are given of the increased need for services
provision in city management due to rapid urbanisation.
Energy insecurity (Figure 2b, 2c) has become a major global issue and the
related pollution management is expensive. Energy inadequacy and illegal
electricity connections are a common phenomenon in most countries of the world
facing the problem of rapid urbanisation, also within Europe – especially within
the Eastern European region. The Public Power Corporation’s (PPC) plant in
Kozani, Greece has been found to be one of the most polluting in Europe. As
reported, PPC will pay up to 2.2 billion Euros a year for carbon emission
licenses unless it shifts away from its dependence on lignite. Consumers could
expect a rise in electricity bills of 45% by 2013 (Figure 2a).

Figure 2a: PPC plants, Greece. (Source: ANA-MPA photographer V.
Varthoulakis) |
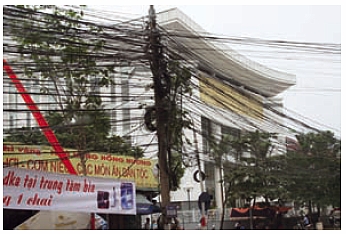
Figure 2b: Energy supply infrastructure, Hanoi. (Source: private
collection C. Potsiou, 2009) |

Figure 2c: Illegal connections in Albania. (Source: private
collection D. Andoni) |
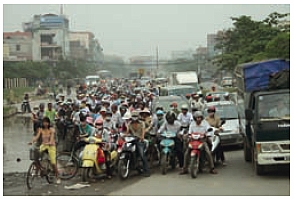
Figure 2d: Traffic in Hanoi, Vietnam. (Source: private collection
C. Potsiou, 2009) |
Traffic management and transportation problems may be demonstrated
statistically. In Mumbai (a city of 14–18 million citizens) 55.5% of the city’s
population walk and 21.9% commute by train. Despite the fact that, Mumbai has a
low level of car ownership (29 cars per 1,000 residents), as published in the
press, more than 20,000 people have been killed on Mumbai’s notoriously
overcrowded train system over the past five years, a minimum of 10 deaths daily
on the railways. Statistics from Vietnam report a seriously increased number of
deaths in traffic accidents. With one million vehicles and more than 18 million
motor bikes on the roads, the country’s infrastructure development had failed to
keep pace with increased transportation demand (Figure 2d).
Large congregations of people in relatively limited spaces threaten to exceed
the natural supplies of potable water. Still, as large population centres use
water for many vital purposes, disposal results in the form of sewage and
wastewater in many forms providing the irony of supply shortage versus a
disposal overburden. Fresh water is getting expensive. Most cities in the
developing world discharge their sewage untreated into rivers (from where, as
reported, they also draw their drinking water) or into the sea, together with
farm chemicals and industrial effluents. For example, some years ago a large
quantity of Delhi’s sewage was used for irrigating the agricultural lands. Today
much of the agricultural land has been converted into residential centres.
Garbage management is a major issue in most cities. For example, six thousand
tons of trash is produced daily in the metropolitan city of Athens (Figure 3).
Until 2005 Greece was operating 1,102 open landfills. After a great effort,
Greece has managed to close most of them (about 400 are still operating) and
avoid the high EU penalties. The costs for the regeneration and mechanical
recycling procedure are high though.
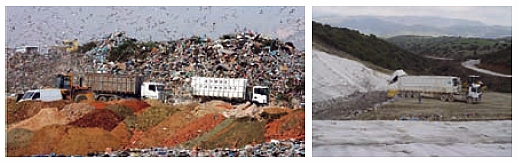
Figure 3: Open landfill (left); regeneration and preparation for
mechanical recycling (right).
The poor migrating in unanticipated numbers from rural areas to cities are
the source of most of the world’s current informal urban expansion. Accelerated
development, pro-poor or affordable housing needs and economies of scale often
lead to high urban densities by tearing down the stock of old buildings,
including buildings of architectural value built to a human scale that reflects
local culture and history.
Affordable housing often means identical concrete constructions of more than
25 m height. For example, in order to achieve economies of scale in the modern
city of Skopje (of only 571,040 citizens) this has recently become the minimum
required height prescribed in the building regulations, while in the past
planners were accustomed to work with maximum permitted height standards.
Safety standards are frequently overlooked for the sake of increased
commercial development with terrible results. Such was the case in some modern
constructions following a strong earthquake in L’Aquila of Italy in April 2009.
As reported by Prof Rangachari, of India, humanity has lived with floods for
centuries but the impact of floods was not felt to the same extent in the past
as is experienced now. Construction in stream and river floodplains or close to
the coast, or in areas where extensive deforestation has taken place due to
rapid urbanisation, presents greater risk of flooding and mud slides. The
results are similar whether in India or in the favelas of Sao Paulo or in the
unplanned settlements of Europe or in New Orleans or in Asia. Natural disasters,
floods, earthquakes and fires are more difficult to deal with in highly
urbanized areas and affect both rich and poor (Figure 4).
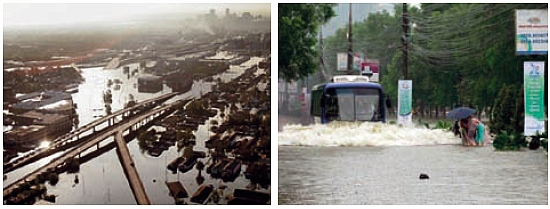
Figure 4: Floods in New Orleans (left). (Source:
http://blog.kir.com/archives/new%20orleans%20flood.jpg ); Hanoi (right).
(Source: Tuan and Duong, 2009)
Rapid population growth leads to increased need for affordable housing in
most cities; the lack of certain policies leads to rapid informal development.
Informal and unplanned development is actually caused by the phenomenon of rapid
urbanisation. As reported in The Economist “the poor, who seem to prefer urban
squalor to rural hopelessness, migrate to the city centres and urban fringe
creating slums” (Figure 5).
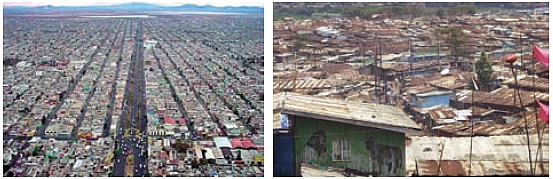
Figure 5: Left: Informal settlement in Mexico City. (Source: private
collection A. Valenzuela). Right: Kibera informal settlement in Nairobi.
(Source: Stig Enemark. 2007)
According to UN statistics, one of every three of the world’s city residents
lives in inadequate housing with few or no basic services. The world’s slum
population is expected to reach 1.4 billion by 2020. Informal settlements,
whether of good or bad construction quality have a common characteristic all
over the world: they do not officially exist. For that reason government
provides nothing, or very little in the best cases.
Slums in less developed areas, whether in Latin America (Figure 5 left),
Africa (Figure 5 right), Asia (Figure 6 left), Ex-Soviet Asia or even in Europe
(Figure 6 right) have a few similar characteristics: unclear land tenure, poor
quality and size of construction, no or poor access to services and violation of
land-use zoning. Crime that flourishes in crowded areas with insufficient job
opportunity is also a common characteristic.
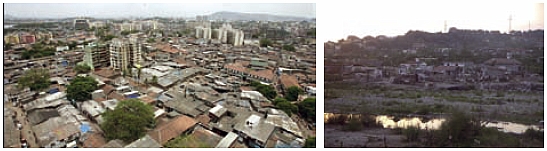
Figure 6: Left: Dharavi, Mumbai, India.
(Source:
http://news.bbc.co.uk/2/shared/spl/hi/world/06/dharavi_slum/html/dharavi_slum_intro.stm).
Right: Informal settlement in Albania. (Source: private collection D. Andoni)
Unfortunately in the slum situation changes are difficult and slow because,
as often reported in The Economist, frequently both sides, the
city administrations and the slum dwellers, may enjoy benefits in some cases:
- Frequently, many people make money from the informal housing sector
- Slums provide cheap labour that enables city to operate
- The situation may suit the authorities, since the economy of the city is
supported and at the same time is an alternative to the missing social
housing policy
- Politicians or civil servants may be landlords in slums areas
- Poor rural people or immigrants are offered hope for employment in the
formal economy of the city
- Slums are usually well placed near the city so if the poor do find jobs
they can walk to work
Informal development is also caused by the spread of the low or middle-income
population to the cities’ outskirts and the surrounding rural lands either by
squatting on rural land (Figure 6 right) or by seeking affordable land to
develop self-made housing. This causes an increase of informal real estate
markets and loss of state revenue (by the loss of permit revenue and taxes),
illegal changes in the spatial organisation of landuses and gradual
environmental degradation. This sub-urban population commutes to the city
centres every day consuming energy and increasing traffic and pollution
problems.
The most important threat of rapid urbanisation may be global climate change.
World greenhouse gas emissions, one of the major factors responsible for climate
change, have increased 70% between 1970 and 2004 (Figure 7). Much of the
increase is due to growth in the sectors of energy (+145%), transportation
(+120%) and industry (+65%) and to the reduction of forest land and land use
changes (40%). Many developing economies, in their effort to reduce government
deficits apply flexible or poor environmental regulations for their productive
units in order to achieve competitive advantages in production and attract
international investment.
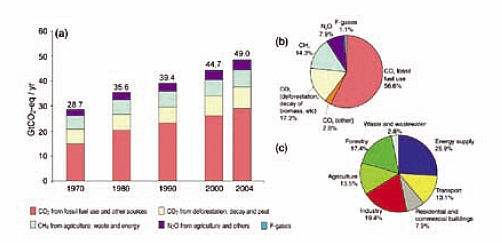
Figure 7: Increase of greenhouse gas emissions. (Source: Wilbanks et al,
2007)
Current development policies are directed at practices leading to climate
change and much research is being carried out to provide more appropriate policy
options for the sectors of energy supply, transportation, buildings, industry,
agriculture, forestry and waste management.
However, urbanisation is considered as an indicator of development, generally
related to industrialised and technologically advanced economies. The
concentration of major economic activities in urban areas produces economies of
scale and leads to various social and economic benefits like employment, better
access to health and education services, trade and cultural activities. While it
is a matter of human rights that people are free to choose where they will live,
all must bear the costs of the natural resources they consume, knowing that
their competitors do the same.
Legislation and regulation are on the agenda of authorities in most
countries. Such legislation cannot always be efficiently applied and relevant
services cannot be appropriately planned without the necessary tools for
provision and dissemination of relevant reliable up-to-date spatial information.
Markets cannot function efficiently without reliable systems to secure land
tenure and zoning and planning systems to define the regulations concerning
private rights for the use of land and natural resources. There is great
activity in most countries around the world to implement spatial data
infrastructures. In some developed countries, spatial information infrastructure
is provided by cadastral, planning and land development permitting authorities.
This is a fundamental tool for sound decision-making, providing for the
management of land in a holistic way. It is a matter of good governance to
achieve sustainable urban growth, but this brings new challenges for land
surveyors, planners, and governments.
1.2 The Rise of Megacities
Urbanisation is an irreversible process. The 20th century has seen the
emergence of megacities (cities with population greater than 10 million). Such
large population concentration in cities is a significant historic change. The
number of megacities has risen from two in 1950 to twenty in 2005. Moreover, 17
out of the 20 megacities in the world are located in the world’s less developed
regions (Figure 8).
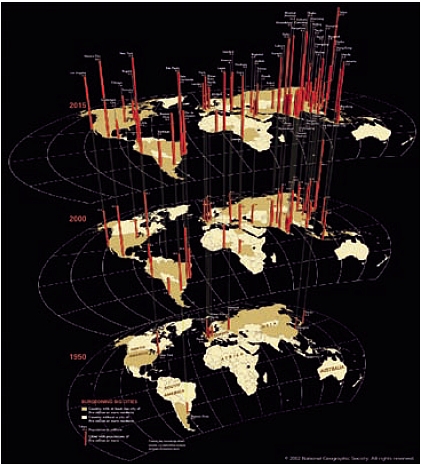
Figure 8: Growth of megacities and prediction for 2015. (Source: National
Geographic)
Ancient Megalopolis, built by Epaminondas in 371–368 B.C., was the capital of
the Arcadian alliance in Greece. It was considered to be the model of a
prosperous, happy and peaceful city. Most current megacities (that share the
same “name” with the ancient city) but also metropolitan cities (cities up to 5
million) do not experience a similar quality of life, since global population
growth is becoming an urban phenomenon mainly in the less developed regions. It
is ironic that much of what were once considered the major advantages of life in
the city, like security, better housing conditions, and services provision have
now become major disadvantages of urban life, like criminality, slums and lack
of services.
Massive displacement of people to megacities perpetuates environmental
degradation and climate change resulting in the shrinkage of areas available for
agricultural, and causing the loss of livelihoods based on agricultural and
animal breeding. It is clear that sustainable development cannot be achieved
without sustainable urbanisation.
Some trends in megacity growth worth noting are:
- Rising infrastructure costs means that investment is needed from all
sectors of the economy, driving the need for public/private partnerships for
infrastructure development and maintenance.
- Transportation congestion is a major challenge. Growth in megacities is
trending towards creation and growth of individual centres or sub-cities,
rather than just growth in the central business district.
- Over half the growth in megacities will be in Asia.
- The 20 largest cities consume 80% of the world’s energy use and 80% of
greenhouse gas emissions come from urban areas. Cities are where climate
change measures will either succeed or fail.
- Informal settlements are especially vulnerable to climate change impacts
as they are often built on hazardous sites in high-risk locations.
- A city “can be run on information” and cities will be differentiated by
their effective use of technology. For example, the Internet will be a tool
for city planning, where everything can be connected and there will be
increased use of sensor webs as input to city administration.
- Megacities exert significant economic, social and political dominance
over their surrounding areas. Mega-urban regions are growing, especially in
China (Pearl River Delta) and the US (central east coast) to create clusters
of cities or “system of cities” and while not megacities in the traditional
form of centre and suburbs, they will form “multi-centre megacities”. This
form of urban area will exhibit both a strong internal and international
spatial-economic relationship. Is a new science of international “spatial
econometrics” needed to measure social, economic, environmental and
governance outcomes?
- There is a clear dichotomy between the terms “world or global cities”
that are based on interconnections and economic function and megacities,
which is based on size. It is not just a developed versus developing country
paradigm, but rather the reason the city is growing. For example, the growth
in Chinese cities is based on an outward looking global focus, while some
cities (especially in Africa) are driven by internal population changes.
This means that analysis of needs of cities will be differentiated not just
on geography but also on economic function and “connectedness” with the
global economy.
1.3 Problems Identified in Megacities
During 2007–8 for the purposes of this research study, initial data about
problems facing city administrators were obtained from seven cities (Hong Kong,
Tokyo, Seoul, Istanbul, London, New York and Lagos) either by their direct
response to the questionnaire (Q) or by personal visits (V) and interviews by
the authors and contributors. Table 3 shows the information derived from that
stage of research.
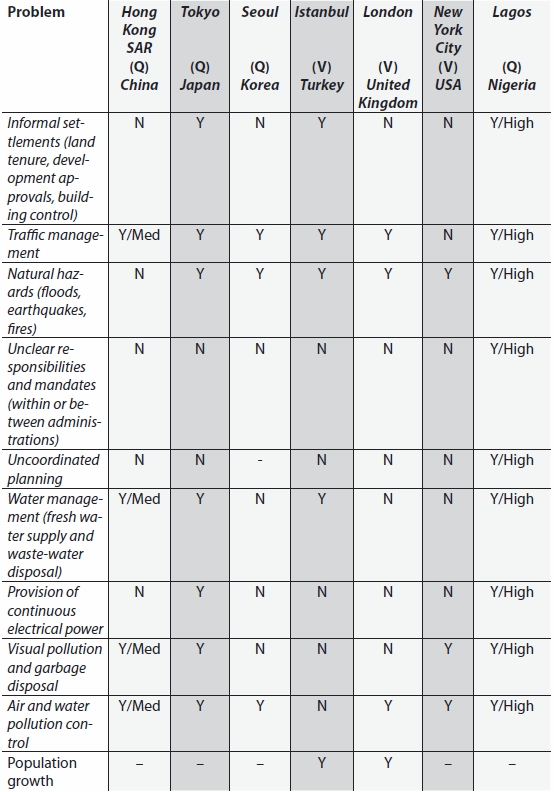
Table 3: Key Problems Facing City Administrations.
Further research indicated that informal settlements are a problem in most
megacities, mainly in countries where development controls, housing policies and
tenure systems are immature and land administration capacity is low. A
particular problem reported by one city is development being allowed in water
catchment areas used by the city, but not under development control of city
planning authorities. Some of the experience with planning and development laws,
regulations, procedures and systems used in some of the cities may be useful to
others.
Traffic management is a common problem. City transport and police agencies
were not part of the initial information gathering. Given the commonality of the
problem, this may be an area for further study.
Natural hazards and emergency management were high on most cities’ lists of
concern. Risk profiles from floods, fires, earthquakes and other hazards differ
among cities, but capacity to plan, prepare, respond and recover from disasters
is a common issue.
It appears that unclear responsibilities and mandates (within or between
levels of administration) are not considered by the administrators who were
interviewed to be a major issue for cities studied. However, all cities under
study appear to have problems with overlapping responsibilities amongst internal
and external agencies, leading to operational dysfunction such as a multitude of
agencies holding non-accessible spatial data. It is clear that solutions to
problems facing megacities require concerted response from many internal units
and regional and national agencies in areas such as planning, infrastructure,
development and land use controls, transportation, environmental management and
water management. Mandates might be clear, but rationalisation of functions and
more effective levels of cooperation may still be needed.
It seems that in many megacities, the city administrations do not have
responsibility for all matters covering the full area of the cities. Several
cities reported that their city administrations did not have control over
development, but rather it was the responsibility of subsidiary local government
units (an average appears to be around 30 municipal authorities within the area
of the “greater city”). In some cases other levels of government had land use
and development control responsibilities. So, even if city planning is centrally
coordinated, often city administrations have little control over the
implementation (land use and building controls) of these plans. In short, some
city administrations have control over key city development functions; others do
not. The influence of megacities reaches well outside their administrative
boundaries to the peri-urban and regions beyond. It is essential that the
greater region be managed holistically to maximise the economic benefits of the
city. Regional planning places even greater emphasis on effective governance of
the larger region, cooperation in planning and development control and
information sharing.
An area for further study may be the role of infrastructure providers, such
as utility services, not being part of the city planning and development
process. In many cases, these authorities are not part of the city
administration, being private enterprise or being located at another level of
government.
Environmental management, especially pollution control, is another problem
area reported by several cities. Again, the experience of some cities in
managing environmental problems may be useful to others.
The inevitability of further population growth is likely to be a common
issue. Some cities reported that their administrations have little control on
population growth. It was a regional or national issue and must be addressed at
that level. However, city administrations need to address the consequences of
growth, which will add further stress to existing systems and facilities, even
for those cities not experiencing problems at the moment. Just finding enough
housing for people will be a common problem. Monitoring population change
effectively and being able to respond through planning and infrastructure
development will be major challenges.
Further research on megacities concluded that impacts might be briefly
classified as following:
- High urban densities, lack of green areas and loss of buildings
reflecting local cultural heritage and of local historic or architectural
value
- Informal development, insecurity of tenure, informal real estate
markets, illegal construction both within the city and in the periphery;
dilapidated city centres, creation of slums
- Unsustainable land use
- Commuting problems, traffic congestion
- Food, water and energy insecurity
- Lack of basic services such as public transportation, fresh water,
parking areas, waste management, sanitation and public toilets
- Poor natural hazards management in overpopulated areas (floods, fires,
earthquakes)
- Crime, increase of social and economic inequalities
- Water, soil and air pollution; environmental degradation
- Climate change
- Inefficient administration, bad governance.
All the above impacts have a clear spatial dimension.
1.4 The Need for Developing New Spatial Tools
The rapid growth of megacities causes severe social, economic and ecological
problems. How can this growth be nurtured in a sustainable way? The challenge
for spatial professionals is to provide megacity managers, both political and
professional, with appropriate ‘actionable intelligence’ that is up-to-date,
citywide and in a timely manner to support more proactive decision making that
encourages more effective sustainable development.
New tools, techniques and policies are required to baseline and integrate the
social, economic and environmental factors associated with megacities, to
monitor growth and change across the megacity and to forecast areas of risk –
all within shorter timeframes than previously accepted. This will lead to more
proactive urban planning and environmental management.
Spatial (locationally referenced) information has become indispensable for
numerous aspects of urban and rural development, planning and management. The
increasing importance of spatial information has been due to recent strides in
spatial data capture (especially satellite remote sensing), management
(utilising GIS and database tools) and access (witness the growth in web
mapping), as well as the development of analytical techniques such as high
resolution mapping of urban environments.
A key factor for success will be utilisation of spatial information and
technologies to support the operation of the allocation of property rights,
housing needs, land use planning, land management and taxation. They will also
support management of key problems such as disaster management, flooding
control, environmental management, health and transportation.
Just as importantly, managing performance of cities including monitoring,
evaluation and reporting functions is a key challenge. This includes data
collection and analysis and a conclusion reached was that you couldn’t monitor
performance without relevant quality (spatial) information.
The study has found that spatial information and technology is being
recognised widely as one of the tools needed to address the big urban
problems, but there is still a general lack of knowledge amongst communities of
practice about how spatial solutions can be used. The key action required
is knowledge transfer, especially amongst users in city administrations. Use of
case studies demonstrating current best practice in selected cities could be a
way of showing other cities what is possible. However, detailed solutions will
need to be tailored by spatial professionals in each instance.
2. Technical Innovation in Management
of Spatial Data
2.1 Current Approaches to Urban Spatial
Information Management
Following rapid urbanisation, the need for updated, precise and continuous
representation of our natural environment in general and urban areas in
particular, is nowadays one of the more urgent and major tasks the surveying and
mapping community has to answer and provide adequate solutions. Major
technological developments in data collection and data integration and analysis
have been introduced as part of the ICT revolution. These new data acquisition
technologies on the one hand, and methods, algorithms and software packages on
the other hand, have allowed surveyors, computer experts and the mapping
community to provide rapid and frequent updating, integration and analysis of
existing spatial databases, and moreover, deal with data volumes, resolution
levels, and accuracies that were unknown until recently.
Land management underpins the distribution and management of a key asset of
any society, namely its land. For western democracies with their highly geared
economies, land management is a key activity of both government and the private
sector. Land management and especially the central land administration component
aims to deliver efficient land markets and effective management of the use of
land in support of economic, social, and environmental sustainability. The land
management paradigm, as illustrated in Figure 9, shows the role of land
administration functions (land tenure, land value, land use, and land
development) and how land administration institutions relate to the historical
circumstances of a country and its policy decisions.
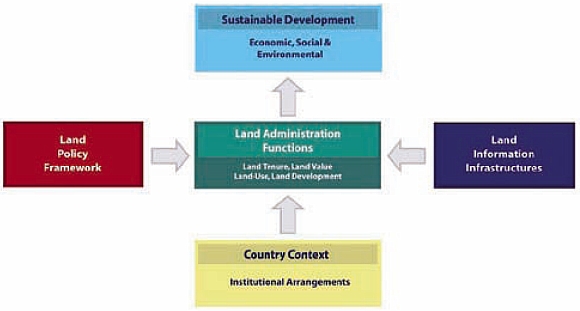
Figure 9: The land management paradigm. (Source: Enemark et al., 2005)
In cities where this land management paradigm exists and is fully functional,
change information associated with the ownership, value, use and condition of
land and property can normally be obtained from the operational level; where
services such as land registration
and cadastral mapping, taxation and development control are provided. This
assumes that there is the means to technically and institutionally integrate
these component themes of land and property information from a variety of
agencies and local authorities into a truly citywide information resource that
can be disseminated to decision makers; this is rarely the case even in the
western world. In this situation, information is available to formulate robust
land policies and to quickly monitor the effect of these policies.
However, in the context of most megacities, a robust information management
system to support this land management paradigm does not exist. The explosive
growth of the city and the fact that a large proportion of development takes
place outside the formal land management and administration process does not
support the luxury of change information being fed through from operational
services. In addition, the participation of citizens in the decision making
process is severely limited since ‘communities’ are informal and not integrated
into municipal structures. Robust land administration and management
institutional structures are needed but as they are time and cost demanding they
may not be introduced into the majority of megacities in the short term. Some
governments require tools and techniques that may provide results for megacity
management immediately. Therefore, complementary new and innovative sources of
information and its management may be used with the objective of immediate
results. Urban sensing techniques may be voluntarily used, as pilot projects,
and provide a potential source of some of this essential missing information.
The challenge is to provide political and professional megacity managers,
citizens and communities with appropriate, up-to-date, citywide information for
immediate proactive decision making that encourages more effective sustainable
development. But institutional constraints and traditional approaches to
large-scale mapping and urban information systems do not always deliver
information in a timely manner.
Emerging technological developments and techniques have the potential to
strengthen the spatial data infrastructures (SDI) and urban change information
so desperately needed. These technological developments can be divided into four
groups, namely: (i) data collection; (ii) data integration, processing and
analysis; (iii) change detection; and, (iv) potential use of urban sensors.
2.2 Data Collection Technologies
Until recently, spatial data was basically acquired and measured by one of
the following three different techniques:
- Photogrammetry, which utilizes stereo pairs of aerial or space imagery
covering approximately the same area;
- Field surveying that utilizes total station and Global Positioning
System (GPS) receivers for a direct field measurements;
- Cartographic digitization and scanning, which utilizes raster
vectorisation techniques to convert existing maps.
Recent technological developments feature two new techniques in addition to
the existing ones:
- Radar based systems, utilizing radargrammetry techniques as well as
Interferometric Synthetic Aperture Radar (IfSAR) imaging;
- LiDAR (Light Detection and Ranging) that produces 3D point cloud
representing the scanned region.
2.2.1 Photogrammetry
Photogrammetry utilizes a pair of stereo images covering approximately the
same area from two different directions and positions to produce a stereoscopic
model. The geometric properties of objects are determined from the acquired
images by a metric measurement of 3D coordinates. Usually, large regions are
covered by an aerial strip or a block containing a large number of photographs
(and stereoscopic models). As a result, aerial imagery is probably the most
common and most effective source to map a region (usually acquiring a digital
geospatial dataset or database of the region), as well as to update existing
maps (or GI databases).
Similar to aerial imagery, satellite images are common today and are being
used in photogrammetry, usually only for production of maps at smaller scales.
Though satellite imagery resolution is becoming denser, aerial images still
present higher resolution – and are relatively more accurate. The horizontal and
vertical accuracy is a variable figure that is a function of the sources and
photogrammetric equipment utilised to collect the data. It is worth noting that
high quality digital imagery is increasingly available with the development of
digital aerial cameras since the 1990s and small digital metric (aerial) cameras
in the last few years. Additionally, with the progress in high performance
computer hardware and software, automation of part of the photogrammetric
processes becomes feasible and techniques from image processing and computer
vision have been successfully employed.
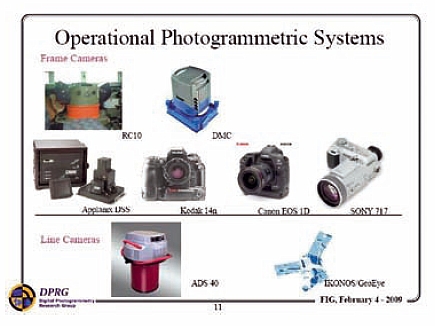
Figure 10: Operational Photogrammetric Systems. (Source: Habib, 2009)
2.2.2 Field Surveying
Traditional field surveying techniques acquire the precise location
(position) of certain points on earth, i.e., coordinates, by direct measurement.
Measuring distances and angles while utilising total-station, or GPS receiver
can do this task. Though the accuracy of a position acquired here is very high
(in respect to other techniques), this type of equipment deliver much fewer data
and is usually used to measure and map only small areas, especially when high
level of accuracy is required in dense urban areas. Field surveying is usually
being used to measure ground control points as a basis for the photogrammetric
process.
2.2.3 Cartographic Digitisation and Scanning
Digitisation and scanning can be performed on maps in order to “transform”
existing graphical paper maps to a digital dataset (probably as input to a
digital geospatial database). This can be achieved by: i) vector-based line
following, and; ii) raster-based scanning. Though manual digitisation is still
performed, semi-automated and automated algorithms are becoming more available
nowadays, and many off-the-shelf geographic information systems software
packages are equipped with tools delivering these tasks. Manual quality
assurance was widespread when applying theses tasks, though with new automated
developments it is becoming less common – and eventually will disappear. Until
recently, producing a digital database using digitisation of medium-scale to
small-scale maps was very common. Nowadays, these techniques are being used
mainly to “digitise” graphical maps of underground infrastructure networks (such
as water and sewage networks) where direct field surveying might not be possible
or too expensive.
2.2.4 Radar Based Systems
Synthetic Aperture Radar (SAR) technology based on Doppler frequency shifts
principle is utilised mainly to acquire images, but these images are very
sensitive to terrain variation. Until recently, SAR images were utilised mainly
to produce digital terrain models (describing the terrain) either by
radargrammetry algorithms by parallax measurement (principally similar to
traditional photogrammetry only here it utilises intensity data for
measurement), or by interferometric algorithms by phase shifts extracted from
two acquired epochs.
In the last few years, based on the remote-sensing satellite technology,
small and compact high-resolution radar systems have been developed. These
systems can monitor land and buildings from the air as well as from space and
are used to monitor structures such as dams, harbours, canals and buildings,
leading to mapping of urban areas, for example for planning and cadastral
updating. Several flights over the same location enable users to discover
changes between pictures, revealing ground movements that could affect
structures. This technology can be used for accurate mapping, deformation
monitoring (down to millimetres), change detection and many other applications.
Since the mid 1990s, LiDAR technology has been becoming an applicable and
available tool for surveying and processing of geospatial data. This system
provides a dense and accurate 3D points cloud of the scanned area. The LiDAR
system integrates three subsystems: laser scanner, Global Positioning System
(GPS) and Inertial Navigation System (INS). The general concept of this system
is precise measurement of the time that the pulse generated by the scanner
travels to and from an object it hits on the scanned area (i.e., from the launch
epoch to the receive epoch). Combined with the GPS and INS subsystems, accurate
calculation of the spatial location of the object becomes feasible.
Although the LiDAR system provides a dense 3D points cloud that describes
accurately objects within the scanned area, it is not an explicit
representation. This is due to the fact that points cannot be classified
automatically and semantically as terrain, trees, vegetation, objects (such as
buildings), and so on. Moreover, the amount of data is relatively large, and in
respect to file size can be several gigabytes. Therefore, an automatic or
semiautomatic technique is required to analyse the acquired data. Different
strategies to differentiate between ground point and non-ground points such as
buildings have been developed in the last few years. These approaches enable
automatic (or semi-automatic) reconstruction of buildings and other natural and
man-made objects and receive a 3D map of the measured urban area.
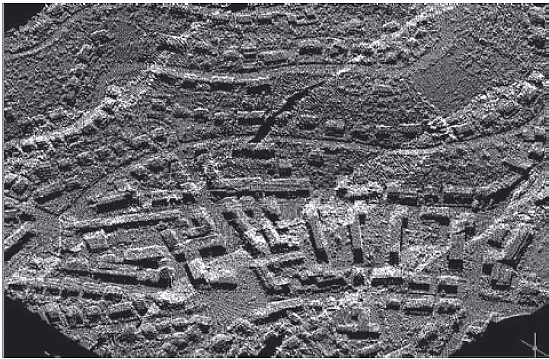
Figure 11: Sample of LiDAR data – a 3D view of urban neighborhood.
2.3 Data Integration, Processing and Analysis
During the last decades, major and significant developments have occurred in
algorithms, methods and software packages dealing with data integration, data
processing and data analysis. These developments have improved the ability to
handle and process geospatial information. A few of these abilities are
presented in the following sections.
2.3.1 Data Integration
Various institutions collect digital maps using different means, representing
different disciplines, kept in different databases and maintained separately.
Urban areas in particular are covered by diverse geographic information sources.
These facts lead to partial different representations of the same world reality.
In order to efficiently use the information, it should be obtained from
different sources and merged together by applying an integration process.
Mechanisms for overcoming spatial and semantic heterogeneity in diverse
information sources are critical components of any interoperable system. In the
case of diverse geographic information sources, such mechanisms present
particular difficulties since the semantic structure of geographic information
cannot be considered independently of its spatial structure. The issue of
integration is even more complicated due to the fact that the different digital
datasets (or databases) can contain data in vector format (a discrete data
structure, where entities in the world are represented by objects) as well as
raster format (a continues data structure, build of a two dimensional array of
pixels, where each pixel represents a characteristic of an equal area
rectangular of the world). Moreover, a simple solution of overlaying the
different digital datasets (by using the straightforward “cut and paste”
algorithm) is not applicable due to different geodetic projections and datum.
Integration of heterogeneous datasets has received a lot of attention in the
last 1–2 decades. Many researchers have proposed different approaches to the
issue. One of these approaches is architecture of wrappers and mediators for
integration systems. According to this approach, wrappers extract data from
heterogeneous sources and transform the extracted data to a uniform format. A
mediator receives data from the wrappers and integrates it. Integration of
spatial datasets by finding correspondences between schema elements was also
proposed. It was shown that interoperability can be achieved in applications
that manage spatial data.
Generally, there are two different types of applications for integration of
geospatial datasets, namely map conflation and data fusion. Map conflation is
the process of producing a new map (digital dataset) by integrating two existing
digital maps. Map conflation of two geospatial datasets starts by choosing some
anchors (see the figure below). The anchors are pairs of points, from the two
datasets, that represent the same position in the real world. A triangular
planar subdivision of the datasets with respect to the anchors (for example by
using Delaunay triangulation) is performed and a rubber-sheet transformation is
applied to each subdivision. Figure 12 depicts a conflated map based on two
different road layers from two sources.
Whilst map conflation deals with integration of vector datasets, data fusion
refers more to the process of integrating raster data from multiple sources. In
the first step of a fusion, objects or points of interest are extracted from the
raster sources using imageprocessing algorithms. In the second step, matching
algorithms are applied in order to join the extracted information. The
corresponding objects, which are discovered in the second step, can be used as
geo-references for matching and fusing the raster datasets.
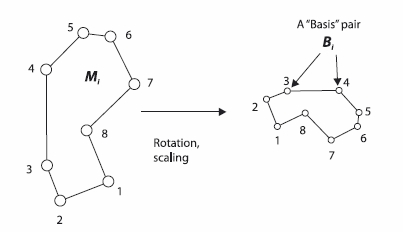
Figure 12: Conflation is depicted by the necessity to use “rotation”,
“scaling” and “translation” operations on homologous objects. (Source: Gabbay,
2004)
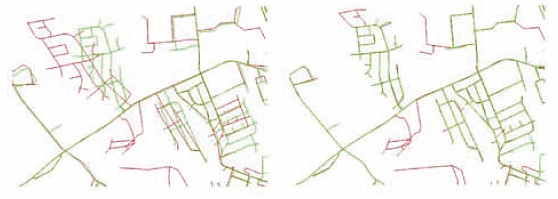
Figure 13: A conflation process – two original datasets (left) and the
conflated overlaying result (right). (Source: Gabbay, 2004)
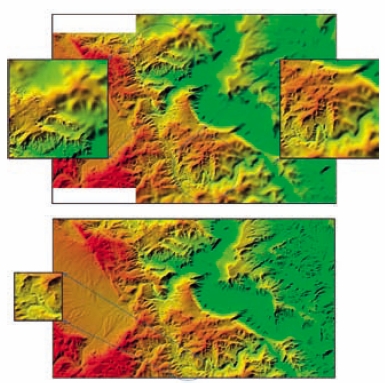
Figure 14: A low quality result of a simple overlapping of two terrain
datasets of different densities (top), and a continuous topological
representation and correct structures of the terrain (bottom). (Source: Katzil
et al., 2005)
2.3.2 3D DTM /raster Data Integration
Digital terrain models (DTM) that cover very large regions are usually stored
as grid (raster) datasets, in which for each grid-point (cell) a height value is
given. The main advantages of this method are data handling simplicity and fast
data access (needed for various analyses procedures – mostly real-time ones).
Usually, datasets that were sampled with high accuracy (and hence are usually
dense) will cover smaller regions than the ones sampled with lower accuracy.
Simple overlay integration of these separate datasets – can produce model
errors, discontinuity and incompleteness. For applications such as visibility
maps, terrain analysis and others, utilising models that are incomplete and
discontinuous will eventually lead to an incorrect outcome. Direct comparison of
different datasets representing the same area can be utilised for morphologic
tasks, such as change detection. By superimposing the two models the height
difference value of the two models will give a qualitative analysis of
topographic changes between the two epochs of collecting the data. In the past,
common techniques such as “cut and paste” and “height smoothing” were in use.
These techniques are characterised by not preserving the spatial morphology and
topography of the terrain.
New approaches and new algorithms were suggested in the last few years, in
order to avoid these complications when integrating terrain relief models. These
algorithms serve as the basis of establishing reliable and qualitative
environmental control processes. As opposed to the previous common techniques,
which did not or only globally analysed the corresponding topography of both
datasets, in the new algorithms a local thorough investigation of the relative
spatial correlations that exist between the datasets is achieved. This prevents
distortions as well as an ambiguous and ill-defined modelling analysis. These
algorithms are aimed at achieving a continuous topological representation and
correct structures of the terrain as represented in the merged DTM, while taking
into account the differences in both height field and planar location of terrain
entities.
It is worth noting that similar approaches are being implemented when raster
datasets (images) are to be merged. The figure below depicts an integration
process of two datasets with different level of detailing into a hybrid unified
dataset.
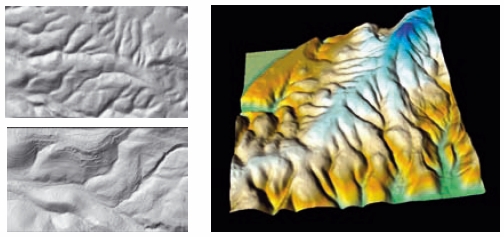
Figure 15: DTM (top-left) and LiDAR (bottom-left) datasets showing
distinctive differences in level of detailing and accuracy (mutual coverage area
is denoted by a dashed rectangle); hybrid dataset (right, rotated 900 counter
clockwise) produced by integrating these datasets (mutual coverage region on
lower-right area). (Source: Doytsher et al., 2009)
2.3.3 Constructing a Seamless Geospatial
Database
One of the common procedures in establishing geographic databases is
constructing a seamless database based on separate adjacent maps. The conversion
of paper maps such as cadastral blocks into digital data (through processes of
digitising or scanning and vectorisation) is usually performed separately, map
by map, and only at a second stage are all the separate maps combined into one
continuous database. Between adjacent digital maps, gaps and overlaps can be
found due to various factors. Among those may be included the accuracy of
digitising or scanning processes; inaccuracies inherent in the original
drawings; non-homogeneous interpretations by different operators during the
input process of boundary lines of adjacent maps, and so on.
Edge matching means the determination of common boundaries of the adjacent
maps, thus annulling the gaps and overlaps and achieving continuity of details
passing from one map into another (such as roads and power lines). During this
process only points lying on the external boundaries of the maps are corrected,
thus obtaining a unique definition of those boundaries. This process does not
normally correct or change features or points that fall within the map itself
and therefore, relative distortions and discrepancies occur between the contents
of the map and its boundaries.
It is possible to ignore this phenomenon of relative “disorders” between the
boundaries of the maps and their content in cases of low accuracy data and/or
maps at a small scale. Nevertheless, when handling geospatial data of urban
areas in general and cadastral information in particular, these disorders and
distortions cannot and should not be ignored. In these cases, edge matching is
insufficient and it is recommended to apply non-linear transformations to solve
existing disorders and distortions. Non-linear transformation or rubber-sheeting
refers to a process by which a digital map or a layer is “distorted” to allow it
to be seamlessly connected to adjacent maps or layers, and/or to be precisely
super-imposed to other maps or layers covering the same area. In the last few
years various approaches to rubber sheeting have been developed with various
proposed solutions, including a polygon morphing technique associated with a
Delaunay triangulation, a non-rectangular bilinear interpolation, a
triangulation and rubber-sheet transformation for correcting orthoimagery, and
others.
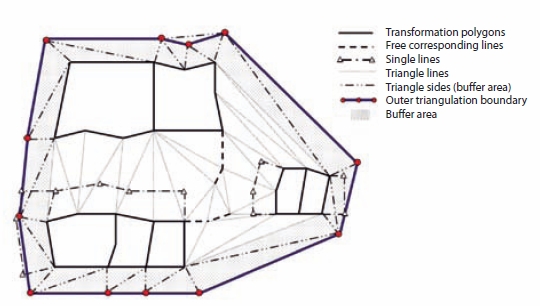
Figure 16: A triangulated rubber-sheeting map sub-division. (Source: Nimre
et al., 2003)
2.3.4 3D City Modelling
Generating 3D city models is a relevant and challenging task, both from a
practical and a scientific point of view. This type of data is extremely
important in municipal management, planning, communications, security and
defence, tourism, and for many other urban management purposes. Most of the
input data for these systems was until recently collected manually “point by
point” on digital photogrammetric workstations (DPW) or analytical
stereoplotters. In the last two decades, extensive research dealing with 3D
building extraction from aerial images on the one hand and from LiDAR points
cloud on the other hand has been carried out by the photogrammetric and computer
vision communities. However, full automation of object space extraction by
autonomous systems is still far from being realised.
There is a great variety of algorithms for automation in building extraction
both from aerial images as well as from LiDAR data, algorithms depending on the
type of building, level of required detail, usage of external and a priori
information, and level of automation and operator interference.
As to aerial images, most of the 3-dimensional algorithms are based on
processing at least two solved images (a photogrammetric model) and the
assumption that roofs are composed of several spatial polygons and that they can
be obtained by extracting all or even only some of them (when the model is
known). The algorithms can be divided into two types: those that extract a
contour and height (2½D) of flat roof buildings and those that extract the
detailed roof (3D) of the buildings. In the figure below the steps of automatic
extracting 3D buildings are depicted.
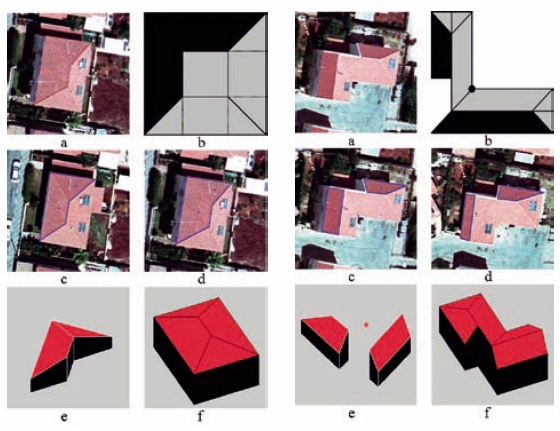
Figure 17: Steps in automatic extraction process of 3D building from
aerial photographs (G-Model roof – left; L-Model roof – right). (Source:
Avrahami et al., 2008)
Since LiDAR technology provides a dense and accurate 3D points cloud of the
scanned area only as an explicit representation of the ground surface (terrain
together with all connected man-made objects), algorithms has to be developed in
order to extract the buildings 3-dimensionally. The extraction of buildings from
LiDAR data is usually divided into two parts where the first involves their
detection within the points cloud and the second the reconstruction of their 3D
shape. Different approaches have been suggested for their detection. These
approaches include: edge operators to localize buildings; morphological opening
filters to identify the non-buildings; local segmentation to identify detached
solid objects; using of external data in the form of ground plans to localize
the buildings, and many others.
As for the reconstruction of 3D shapes of buildings, the extraction of the
roof primitives in almost all cases is based on segmentation of the points cloud
that will seek partition into a set of planar faces. While a large body of
research has been devoted into building reconstruction, many challenges still
remain unanswered. One such challenge concerns the general planar roof-face
assumption that is common to almost all reconstruction models. While planar
roof-face buildings are still the majority, buildings with general roof shape
can be found in almost every scene. The reconstruction results of buildings are
depicted in the following figures.
A sample of extracting the buildings of an urban neighbourhood from LiDAR
data is shown in Figure 21. Even though the LiDAR information in this scene is a
non-dense points cloud (only 0.6 points per square-meter), the results of
extracting the complex buildings, as depicted in the figure below, is
impressive. It is worth mentioning that new LiDAR systems are capable of up to
18–20 points per square-meter resolution and the potential for extracting very
detailed urban scenes and build accurate and precise 3D city models is very
high.
There are two types of laser scanners, namely, airborne and terrestrial. Even
though the characteristics of the two types are similar, they are dissimilar in
terms of the measuring range, density of the measured points cloud, precision,
and other factors. Using terrestrial laser scanners is being used to construct
realistic 3D building facade models of urban scenes. These models are beneficial
to various fields such as urban planning, heritage documentation and better
decision-making and organization of the urban environment. Laser data and
optical data have a complementary nature when extraction of 3-dimensional
feature is required. As efficient integration of these two data sources will
lead to a more reliable and automated extraction of 3D features, automatic and
semiautomatic building facade reconstruction approaches and algorithms have been
developed that efficiently combine information from terrestrial laser point
clouds and close range images. The result of a terrestrial laser scanning (a
points cloud containing several hundred thousands points) presented in the
figure below depicts the inherent potential of this technology to construct
realistic 3D building facade models of urban scenes.
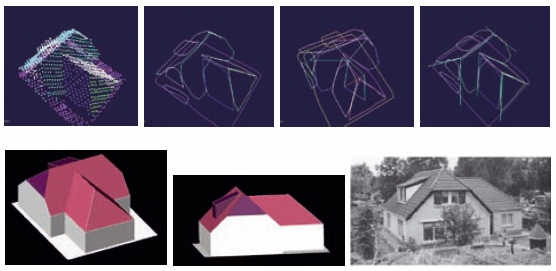
Figure 18: Steps in automatic extraction process of 3D building from
LiDAR data – segmentation → segments handling
→ topological analysis →
line and vertices extraction (top from left to right); the extracted 3D building
and results verification (bottom from left to right). (Source: Abo Akel et al.,
2006)
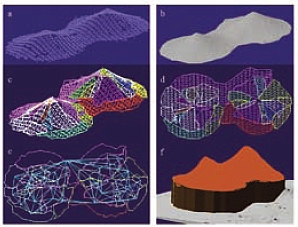
Figure 19: Reconstruction of a building with a free-form roof
surface: (a) point cloud; (c) segmented point cloud; (d) segmented point
cloud in down-looking view; (e) connectivity graph; (f) reconstruction
results. (Abo Akel et al., 2009) |
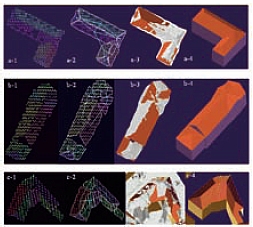
Figure 20: Reconstruction results of three complex buildings.
Left to right: segmented point cloud; segments boundaries; roof
topology; final reconstruction results. (Abo Akel et al., 2009) |
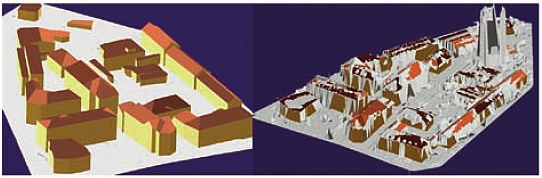
Figure 21: A 3D view of an urban neighborhood showing the original LiDAR
data (right) and the complete reconstruction results (left). (Source: Abo Akel
et al., 2009)
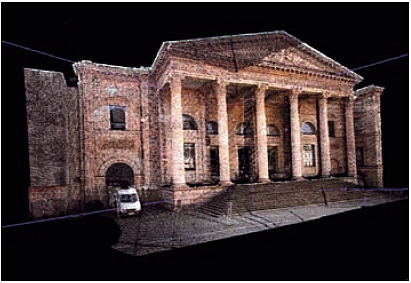
Figure 22: Results of a terrestrial scanning of a complex facade.
2.4 Change Detection
2.4.1 Change Detection Attributes
Automatic change detection in the field of photogrammetry can be used to
monitor manmade objects (structures) like roads and buildings. This process is
necessary for map updating, particular in urban areas (and megacities), a
process which is an otherwise expensive and time consuming task if done
manually.
Although in its general form the problem of automatic change detection is
complex and difficult to solve, on well-defined applications it is possible to
achieve good results by imposing certain constraints. The available change
detection methods are many and diverse. However, the basic attributes of all
these algorithms are mainly common and any differences are due to different
combinations of attribute values. The following are some of the most distinctive
attributes (Psaltis and Ioannidis, 2010):
- Scale of the changes to be detected. Scale of change can be illustrated
with a simple example. If the user needs to detect changes in the
development of the urban area limits then whole groups of buildings can be
thought as one and thus the data needed to depict this type of change can
have small scale. If the user is interested in detecting change in single
buildings, then the data necessary should be of high scale in order to
better represent the objects of interest and thus this is considered a large
scale change detection problem.
- The type of the basic comparison unit. Basic comparison unit is called
the feature, which is compared between two time periods for assertion of
change. Its type expresses the information level it carries, ranging from
low, i.e. grey tone values, to high-level information, i.e. object classes.
The higher the level of information the more robust the method.
- The number of steps (one or two) in which the process is completed. The
two-step approach involves the extraction of objects in both time periods
and then the comparison between them to decide what has changed. On the
other hand, it is possible to complete the same procedure in a single step
by layering the two time periods in a single new product, i.e. a difference
image, and then deciding which features of the new dataset are indicating
changes.
- The path to change detection and incorporation of a priori knowledge,
namely bottom-up or top-down. Bottom-up methods are considered those, which
by dealing initially with raw data, lead to change assertion. The opposite
is true for top-down approaches where certain models of change are searched
and matched to the raw data. In both cases it is necessary to use some a
priori knowledge to bridge the semantic gap between data and change model.
- Deterministic or stochastic approach of the change detection problem. In
a deterministic approach there is a decisive answer as to what change is,
whereas in a stochastic approach there is a measure of how possible change
is. Stochastic methods have the advantage of providing a concrete quality
measure of the results, possibility, and they often are more flexible and
extensible.
- Level of automation, differentiating between autonomous, automatic and
semiautomatic methods. In autonomous method the user just imports data to
the algorithm and gets an output without any further customisations. In
automatic methods, users have to manually tune a set of parameters before
they get the desired output. In semi-automatic methods users complete a
training phase inputting positive and negative samples of change before the
algorithm is able to predict changes in the rest of the dataset. Higher
levels of automation mean less effort from the users, but usually they also
mean lower levels of accuracy and less noise tolerance.
- Type of data used. Data can be divided in two major categories: raster
and vector. Raster data mainly include images from different types of
sensors like airborne or spaceborne cameras, SAR sensors and thermal
sensors, whereas vector data mainly include maps, cadastral polygons, 3D
point clouds and surface models.
2.4.2 Change Detection Strategies
Monitoring the urban and suburban environment for illegal buildings
illustrates the potential of using change detection. Based on some factors such
as land use zones and building regulations, a schematic overview to the problem
is depicted in figure 23.
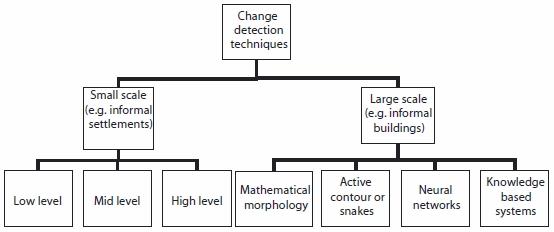
Figure 23: Change detection techniques categorized by scale. (Source:
Ioannidis et al, 2009)
In small scales, such as cases of informal settlement monitoring, the problem
is being addressed by various classification-segmentation techniques from the
field of remote sensing. Such techniques can be categorized as low level, mid
level and high level, in respect to the information used to address the problem.
In small scale, low level techniques consider information in pixel level to
facilitate change. Image differencing, rationing and principal component
analysis (PCA) techniques were commonly used in the past. Today they are still
used in modern processes, but only as part of a wider approach and in
conjunction with each other. Their main weakness is that they are unable to cope
with variations in atmospheric conditions, ground conditions and illumination.
Slightly evolved mid level techniques were introduced to overcome these
problems. Object oriented classification, feature and texture segmentation are
some widely used examples. These techniques are more robust than the low level
methods as they use higher level of information to detect change, but are still
case dependent and difficult to extend. The current trend is to use high-level
techniques. These methods are also known as knowledge based methods or expert
systems. They incorporate cognitive functions to improve image-scene analysis
and they make use of a wide variety of data. Their major advantage is that by
using high-level information and data fusion these systems are robust and
effective, approaching the problem in a more holistic way.
In large scales, such as monitoring individual buildings, the problem is
usually more complicated. A basic procedure can be seen in figure 24. First,
buildings are extracted and then they are back projected to the reference data
where it is determined if there has been a change.
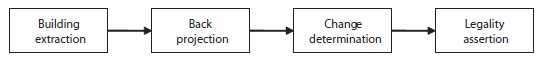
Figure 24: Phases of informal building monitoring. (Source: Ioannidis et al,
2009)
All of the above procedures can be automated, but with different levels of
difficulty and success. Building extraction is by far the most difficult task to
automate. As the algorithms might miss certain objects or include some objects
that are not buildings, such as trees, the results of these procedures should be
carefully analysed by the users.
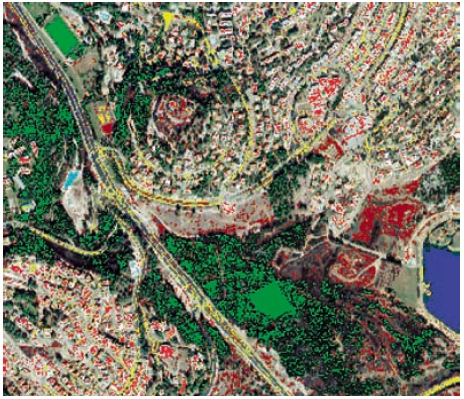
Figure 25: Change detection results – a comparison of satellite imagery and
aerial photograph. (Source: Beit-Yaakov, 2003)
2.5 Urban Sensing
A new generation of citizen-activated sensors in the urban environment is
creating opportunities for collecting and managing a wide range of urban
information. This is termed ‘urban sensing’ and uses a wide variety of sources
including cellular phones, Radio Frequency Identification (RFID) tagged items,
GIS related technologies, Web 2.0 and crowd sourcing (mass collaboration using
Web 2.0) to support the creation of a public infrastructure, a ‘data commons,’
that will enable the citizen to participate (voluntarily) more effectively in
politics, civics (including land administration and management), aesthetics and
science. In this study, the term “citizen-activated” implies a voluntary
citizen activity.
2.5.1 Ubiquitous Sensors
RFID tags are like barcodes that broadcast their information. They are now
embedded in an increasing number of personal items and identity documents,
including transport and toll passes, office key cards, school identity cards,
“contactless” credit cards, clothing, phones and even groceries. Such devices
should only be employed by government with full disclosure and popular
acceptance.
In the USA, new drivers’ licenses (on a voluntary basis) incorporate RFID
tags that can be read – while still in a wallet – from as far away as 10 metres.
Each tag incorporates a tiny microchip encoded with a unique identifier number.
This is designed to make border crossing more efficient. As the bearer
approaches a border station a radio signal causes the chip to emit its unique
number, which is used to search a database to display their photo and other
information to the border agent as they arrive.
Tracking infrastructure could be installed city wide to monitor movement of
individuals. In Alton Towers theme park (http://www.altontowers.com)
visitors can opt to purchase a ‘YourDay’ DVD souvenir. A RFID tagged wristband
tracks them and triggers video recording when they are at particular
attractions. At the end of their visit, they take home a unique personalised DVD
showing them at each attraction. This is a commercial enterprise in the UK with
full disclosure and the understanding of the visitors. It is not a program
imposed by government.
However RFID tags were designed to be powerful tracking devices and typically
incorporate little security. People wearing or carrying them are therefore
vulnerable to surreptitious surveillance, tracking and profiling. Therefore such
devices if they are to be employed by government for any purpose should first be
fully explained to the public for popular acceptance or rejection.
2.5.2 Citizen Initiated Sensors
It is not feasible to set up centrally controlled sensors for all
environmental variables that need monitoring in a megacity. An alternative could
be the implementation of data collection through the voluntary use of mobile
phones. These are becoming passive sensors that silently collect, exchange and
process information continuously. As well as recording sounds, they can record
images and locations and, in the future, cheap sensors may be added to detect
some environmental variables such as air and noise pollution.
Already referred to as M(mobile)-government when directly used by urban
managers, citizens own phones open up additional channels and have significant
potential to increase participation. For megacities, M-government through mobile
phones has the potential to considerably increase the type and currency of
information available, such as pollution incidents, traffic congestion etc. This
information could become part of a public information infrastructure that would
need first to be authenticated, managed, prioritised and acted upon by the
megacity authorities. The obvious downside to these systems is the overloading
of the management agencies with huge volumes of data.
The constant surveillance of peoples’ locations can be highly sensitive.
However, the convergence of location based services (LBS) and social networking
providing real time social interactions has triggered the controlled sharing of
location information with designated people participating voluntarily. People
appear to be comfortable sharing their location information with known
individuals or where there is an incentive. For example, the Massachusetts
Institute of Technology is attempting to alleviate traffic jams using mobile
sensors. It captures real-time location and speed information from fleets of
limousines and taxis as well as road conditions. A central computer then
calculates traffic patterns and can predict optimal routes. In the future, this
could be deployed through smartphones with programs that can perform similar
functions, relying on regular commuters willing to participate who can download
the programs online. So the incentive to provide location information is real
time route optimisation. In megacities, citizens’ incentives could be reduced
transport costs, travel times or road tax.

Figure 26: Personalized estimates of environmental exposure. (Source:
http://urban.cens.ucla.edu/)
2.5.3 Direct Citizen Contributions
e-Government
In developing countries, this e-government source of information is at an
early stage of development and is hindered by the lack of fixed line
telecommunications. But, e-government extended into M-government has a greater
potential within these megacities as mobile communications become ubiquitous.
Crowdsourcing / Distributed Citizen Sensing
Crowdsourcing means that a task or problem is outsourced by an open call to
the public (undefined group of people) rather than another body, for example
Wikipedia. Citizens volunteer to collect and sometimes maintain information for
a variety of initiatives. These on-line communities self-organise into
productive units and have produced some excellent results, including:
- The Great Backyard Bird Count in the USA with volunteers recording bird
sightings;
- Geo-tagged images and videos voluntarily uploaded to sites like Flikr
and Panoramio;
- Public map maintenance introduced by TomTom – called ‘MapShare’.
The ease and increasing use of GPS for data capture, adoption of data
standards, the availability of Web 2.0 tools and the efficiency of mashups for
managing and distributing information are accelerating the growth of
crowdsourcing and distributed citizen sensing. After Hurricane Katrina in New
Orleans, two software engineers created
www.scipionus.com to enable thousands of citizens to post emergency
information on a visual wiki. This became much more important than the official
sources of information. A similar service has operated in California during
recent forest fire events. In Kenya, a web-based reporting tool called ushahidi,
“testimony” in Swahili, enables citizens caught up in political unrest to report
incidents of killing, violence and displacement. It is an open source tool to
aggregate crowdsourced information for use in crisis response.
In Doetinchem in the Netherlands, a 12 metre tall tower (see the figure
below) maps emotions of the inhabitants. The tower changes the lights according
to emotions reflected from the D-tower website (www.d-toren.nl).
2.5.4 Application in Megacities
The new generation of urban sensors has significant potential in providing
the managers of megacities with unparalleled access to a comprehensive range of
current spatial and environmental information about the evolving workings of the
megacity. Peoples’ movements can be monitored; their use and modes of transport
determined and people can voluntarily provide information about changes to their
environment. However a number of prerequisites are indicated:
- Legislative and policy frameworks;
- A system of quality analysis of information and data voluntarily
submitted from unofficial sources.
- Agreement on what information can be captured and how it can be used.
Citizens can choose to opt out; to volunteer information; or to participate
in incentive schemes;
- Appeals for crowdsourcing should focused on topics to help manage the
city more effectively, e.g. environmental damage;
- An information infrastructure to manage, analyse and distribute urban
sensed information to facilitate its widespread use in solving urban
problems; and
- A communication strategy to provide transparency and to ensure that
citizens understand the benefits.
It is probable that people will participate when provided with smooth and
ubiquitous access to information and the ease of providing information through
m-government applications, for example. The increased levels and quality of
participation will most likely take time to evolve as citizens gradually realise
tangible evidence of urban improvements related to their participation. One
initial consequence may be that city authorities just receive hundreds of
trivial requests for services. This traffic must be managed effectively and
acted upon in a beneficial manner by city authorities to build trust with the
citizens.
The successful introduction of urban sensing will involve considerable
cultural and behavioural change of politicians, government officials, the
business community and citizens and develop incrementally as policies and
legislation evolve. It has great potential to fill the current gaps in urban
information needed to understand the dynamics of megacities.
So far at the national spatial data infrastructure level, no country has
generated data management policies that truly integrate and utilise this new,
valuable resource of large scale, citizen initiated information. This paradigm
shift has yet to be understood and absorbed at a national level.

Figure 27: Interactive D-Tower in the Netherlands. (Photo: Henk Vlasblom)
A caveat
Such devices as citizen-activated sensors, RFID and LBS may provide
government with efficient and practical means of data collection in support of
urban management and environmental monitoring.
However, these devices are also potential tools for citizen control by
totalitarian governments. What may begin as traffic control may be adapted to
crowd and demonstration control. The D-Tower of the Netherlands could easily
become a device designed to give a repressive government of some other country a
means of early detection and suppression of popular dissent. All such “urban
sensing” devices must be subject to full public awareness and acceptance. There
must be an enactment of enabling legislation. Due process must be available to
the citizenry of any democracy, including judicial challenge and final
adjudication.
These devices are currently in experimental stages primarily in countries
with developed economies and long established democratic processes. There would
be a major risk in introducing such systems in unstable governments in
developing economies.
3. Spatial Data Infrastructure
3.1 What is SDI?
The concept of spatial data infrastructures (SDI) has been developed to
encompass the efficient and effective collation, management, access and use of
spatial data. SDI has been adopted in many countries around the world, notably
at national level, but frequently found at sub-national levels based on regional
or local government areas. SDI has been seen as a purely governmental mechanism
and it is true that government agencies constitute the greatest collectors and
users of spatial information. However, there is a clear trend to involve diverse
user communities that incorporate elements of the private sector and
non-governmental organisations to ensure that investments in spatial data
development yield the greatest possible benefit.
Definition of SDI
The term “Spatial Data Infrastructure” (SDI) is often used to denote
the relevant base collection of technologies, policies and institutional
arrangements that facilitate the availability of and access to spatial
data. The SDI provides a basis for spatial data discovery, evaluation,
and application for users and providers within all levels of government,
the commercial sector, the non-profit sector, academia and by citizens
in general.
The GSDI Cookbook v2, Global Spatial Data
Infrastructure Association, January 2004 |
Developing and implementing an SDI should be seen as an integral component of
a jurisdiction’s overall social and physical infrastructure planning.
However, the development of an SDI is problematic. Key issues have been the
diversity of data sources and management of spatial data, usually spread across
a multitude of agencies and organisations focused on single mandates. A
challenge has been to develop new institutional arrangements to allow
implementation of appropriate integration of data, adoption of relevant data
standards and meet a growing range of needs for spatial data products. These
arrangements vary from choosing an existing agency to lead SDI development (such
as the agency responsible for land administration), through formal coordinating
committees to formation of a specialist “SDI” agency. The choice will be based
on prevailing administrative, legal and social cultures found in a jurisdiction.
The role that SDI initiatives are playing within society is changing. SDI was
initially conceived as a mechanism to facilitate access and sharing of spatial
data for use within a geographic information system environment. This was
achieved through the use of a distributed network of data custodians and
stakeholders in the spatial information community. However, users now require
the ability to gain access to precise spatial information in real time about
real world objects, in order to support more effective cross-jurisdictional and
inter-agency decision-making in priority areas such as emergency management,
disaster relief, natural resource management and water rights. The ability to
gain access to information and services has moved well beyond the domain of
single organisations, and SDI now requires an enabling platform to support the
chaining of services across participating organisations.
Providing information is a key government function. Information is essential
to enable agencies to produce the government’s expected outcomes and to meet
community expectations. Increasingly, effective sharing of information is
critical to the success of whole of government outcomes. ICT underpins and
enables improved information sharing and information management approaches by
agencies.
The need to share information among agencies or across the whole of
government broadly falls into four categories:
- Dealing with an emergency – the need to pull together all
available information about a specific issue such as responding to
hurricanes or bushfires.
- Integrating information holdings – the need to inform policy
development and foster effective policy outcomes by acquiring, integrating
and analysing available information holdings across government agencies, for
example the Social Inclusion initiative.
- Integrated service delivery – the need to provide services across
agencies in a seamless way, for example using street address to link various
systems and databases.
- Managing areas of joint activity – the need to encourage sharing
of information and investment within and across jurisdictions or with the
private sector.
Improving agencies’ capability to transfer and exchange information, aimed at
improved decision-making and community services and with appropriate privacy
protection, is critical and will require improved interoperability between
agencies’ information systems. In the longer term it will require agencies to
adopt and implement common information policies, standards and protocols.
Potential common frameworks, policies and standards will need to be flexible
enough to respond to agencies’ varying business requirements.
As noted – “the most profound technologies are those that disappear. They
weave themselves into fabric of everyday life until they are indistinguishable
from it.” (Weiser M., 1991) Spatial information has become pervasive in all
aspects of our daily life and is a relatively recent phenomenon. The crux of
this rapid change is due to a number of converging factors involving technology,
applications and standards. These include:
- Plummeting cost of computational power, cost of storage required to
manage and process ever-increasing volumes of spatial data, and cost of its
transmission.
- Greater availability and choice of quality data such as high-resolution
satellite imagery.
- Lowering barriers to data access in terms of licensing costs and
infrastructure provided to deliver these data.
- Low cost of consumer electronic devices that make use of spatial data
such as vehicle navigation and other location-aware devices.
- Emergence of location-based services and new business models underpinned
by spatial data.
- Strengthening of international standards particularly in the field of
web-based interoperability.
- Industry and innovation leadership seized by companies who are not
perceived as traditional spatial system vendors.
- Greater awareness, increasing spatial literacy and savvy of the public
in general.
Spatial analysis can be a heavy user of computer power, data storage and
telecommunications and this cost has been, in the past, a constraint to using
large volumes of spatial data. However, cost per unit storage is declining at
45% per annum. Depending on required operational configuration, cost (in US
dollars) of 1 Terabyte was between $102 and $1,224 in 2007. The cost for the
same amount of storage in 2010 is projected to be between $17 and $204,
diminishing to well under $1 by 2020. Similarly, computation and data
transmission has been put within everyone’s reach. Just like hardware
storage, they follow Moore’s Law. For example 1 GFLOPS (a commonly used measure
of computing performance) cost $0.50 in 2007, as opposed to $1,000 in 2000.
However, the most profound increase in use of spatial data has been through
the convergence of measurement technology, global positioning systems, remote
sensing technologies, mobile devices and communication technologies to create a
locationally- aware capability not thought of several years ago. Demand is for
spatial information that has high resolution, is current, immediate and
available anywhere.
Traditional media and advertising companies have expanded the notion of
‘content’ to beyond their conventional interests: it now includes spatial
information. Google, Yahoo and Microsoft have acquired spatial content and
developed technologies that exploit spatial data to extend, enhance or provide a
completely new range of location-based services.
Finally, there is an emerging trend towards integrated decision support
systems where spatial data plays a pivotal role.
Whole of city administration action that would improve access to spatial data
includes:
- Implementation of protocols to share data between governments.
- Common licence agreements that facilitate efficient access to spatial
data held by governments.
- Comprehensive and up-to-date catalogues of metadata.
- Online access to data through standard interfaces.
- Bulk purchasing arrangements for access to important data.
- Stronger implementation of spatial standards.
Because city programs and their executive agencies often depend on data
collected by other levels of government, transparent and cost efficient access
to jurisdictional data is becoming an increasingly important issue in effective
delivery of national programs. Indeed, structural inefficiency in access to
spatial data could have an increasing impact on national economic activity and
delivery of social and environmental outcomes.
Current problems for agencies finding, accessing and using jurisdictional
data can be summarised as:
- Transactional inefficiency created by diversity of access and licensing
requirements, varying data quality and jurisdictional systems that do not
interoperate.
- Duplication of data collection and management effort due to inability to
easily discover and access existing jurisdictional data.
- Barriers to integrating data across jurisdictional boundaries due to
varying data standards, levels of investment, terminology and practices.
- Lack of clarity in defining data needs when dealing with jurisdictional
suppliers.
The term SDI is often used to denote the relevant base collection of
technologies, policies and institutional arrangements that facilitate the
availability of and access to spatial data. A spatial data infrastructure
provides a basis for spatial data discovery, evaluation, download and
application for users and providers within all levels of government, the
commercial sector, the non-profit sector, academia and the general public.
The word infrastructure is used to promote the concept of a reliable,
supporting environment, analogous to a road or telecommunications network.
Spatial data infrastructures facilitate access to locationally referenced
information using a minimum set of standard practices, protocols, and
specifications. Spatial data infrastructures are commonly delivered
electronically via the Internet.
The development of an SDI initiative should aim to provide better access for
all citizens to essential spatial data. It aims to ensure that users of spatial
data will be able to acquire consistent datasets to meet their requirements,
even though the data is collected and maintained by different authorities.
The implementation of an SDI is based on policy and administrative
arrangements, people and technology, and a means by which spatial data is made
accessible to the community. This infrastructure can be compared to services
infrastructures, such as road, rail and electricity networks. The implementation
of an SDI is usually not to establish a central database, but to set up a
distributed network of databases, managed by individual government and industry
custodians.
The establishment of a city-wide spatial data infrastructure where data
collection, maintenance and delivery capabilities can be shared rather than
duplicated will resolve much of the current problem with duplication, lack of
standards and complex discovery and access to existing spatial data. Such an
infrastructure would also provide additional benefit since there are many other
government (and commercial) activities that can be better served through common
elements in a spatial infrastructure.
There is a need to resist the impulse to micro-manage all aspects of spatial
data collection, management and use across government. Focus should be on a
framework that invests in use of spatial data and provides incentives for
collaboration to achieve national outcomes. The SDI would encompass the physical
aspects of:
Administration
- Policy – implement the comprehensive whole of government spatial
policy.
- Governance – provide high-level governance frameworks and strong
leadership.
- Standards – provide a suitable standards-based framework for data
harmonisation, quality control and access.
Technical
- Discovery and Access – provide easy access to high quality data
and business processes with simple and ‘no’ cost channels using
non-restrictive licensing mechanisms.
- Data and Information Networks – identify authoritative data
sources.
- Enabling Technologies – support best practice use of technologies
to enable the full end-to-end data cycle.
- Spatial Business Processes – facilitate shared spatial business
processes.
3.2 Current Use of Spatial Information in
Megacity Management
Locationally referenced information has become indispensable for numerous
aspects of urban and rural development, planning and management. The increasing
importance of spatial information has been due to recent strides in spatial data
capture (especially satellite remote sensing), management (utilizing GIS and
database tools) and access (witness the growth in web mapping), as well as the
development of analytical techniques such as high resolution mapping of urban
environments. (See table 4.)
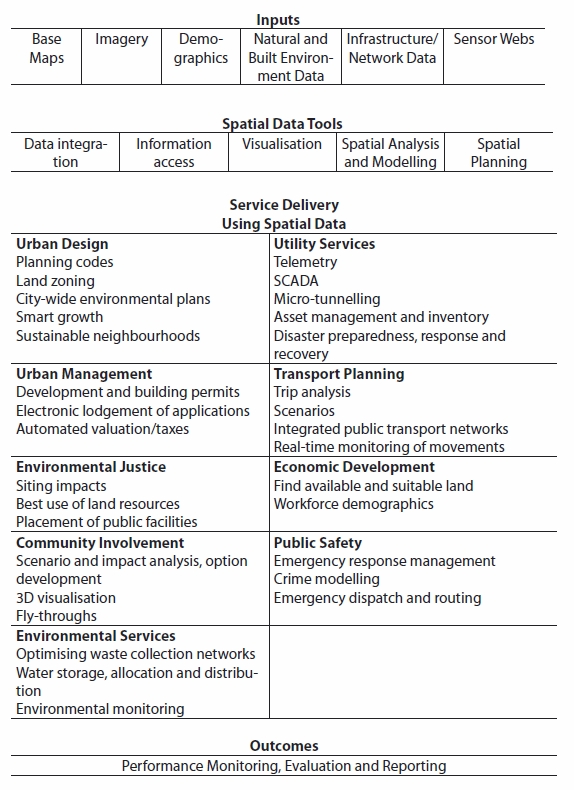
Table 4: Use of Spatial Data in City Administration. (Source: Spatial
Strategies Pty Ltd Australia)
3.3 SDI in the World’s Largest Cities
This section presents the results of an investigation that collected
information about current use of SDI in the world’s largest metropolitan areas
using online resources. A short overview of general NSDI development for all
countries of the world holding at least one megacity will be provided, as will
be the use of SDI or comparable initiatives in the associated metropolitan
areas. Leaving legislative and organisational SDI aspects aside, the evaluation
focuses on the technical aspects of the use of spatial information technology in
megacity management. The classification of the results is done on the basis of
usability and accessibility of spatial data, which was identified by the
internet search.
Like in the home countries of the megacities, the application of spatial
information technology in the megacities of the world is largely diverse. The
table below shows the availability of digital spatial data in the megacities
under review. The application of spatial information technology in the cities
under consideration varies considerably. It starts from the provision of simple
WebGIS applications which only show the road network and some less basic data
like in Jakarta or Mumbai, it comprises advanced applications
which enable the presentation of social, economic, ecological and urban
information related to the city (e.g., Buenos Aires, Los Angeles,
Paris) and it ends up with highly elaborated comprehensive distributed
information systems which can be found in Seoul, London and New
York City.
The evaluation framework used in Table 5 consists of five categories that are
designed to classify all investigated items. If, for whatever reason, only
little information on an item could be found on the web, the corresponding item
was marked with SDI development status unknown. If initial activities
towards SDI development were observed the status SDI master plan available
was given. Primary spatial data available refers to original data, like
survey data, data with limited interpretation like water bodies or boundaries,
which are obtained without analysis or very less interpretation. Secondary
spatial data available refers to thematic data that is derived from
the analysis of primary data, statistical data collection and/or image
interpretation. If the captured data was found to be available via a Geoportal
or a similar distributed web application then the mark Spatial Data
Accessibility available was given.
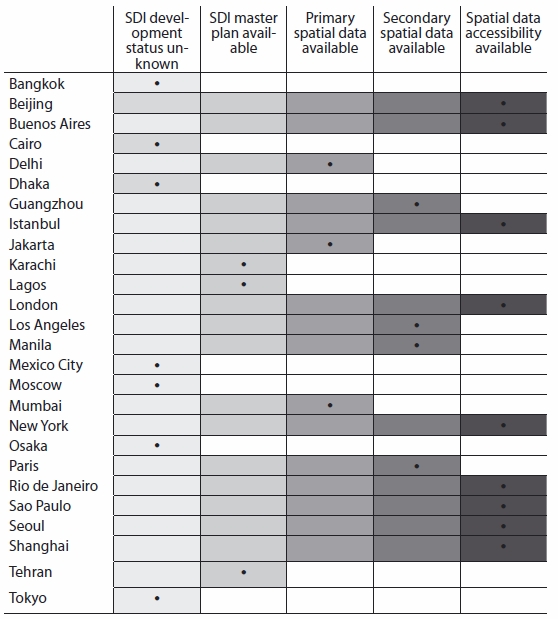
Table 5: Application of SDI in the world’s megacities. (Source: Boos and
Mueller, 2009)
3.3.1 SDI Application in the African Region
NSDI in Egypt is still rudimental. Considering the underdeveloped NSDI
of Egypt, it is no surprise that for the city of Cairo no information concerning
SDI development or comparable initiatives could be found.
Nigeria started the implementation of a National Geospatial Data
Infrastructure (NGDI) in 2003. In 2007, the government of Lagos constituted a
committee for the provision of a fully digital mapping and enterprise GIS for
Lagos State. The policy framework adopted by the administration for the
development of Lagos should be reached by generation and sharing of information
with organised private sector, developing skilled and knowledgeable workers.
3.3.2 SDI Application in the Asia-Pacific
Region
In Bangladesh no official NSDI exists. In accordance with the
rudimental national SDI initiatives in Bangladesh in Dhaka neither city SDI nor
any WebGIS application or similar was identified.
China has paid great attention to construct the Digital China
Geospatial Framework (DCGF). A series of fundamental spatial databases was
completed as the kernel of DCGF. A fully digital nationwide spatial data
production system is widely established. In 2002, the Shanghai Municipal
Government announced the Digital City Shanghai strategy. In this context, a
distributed WebGIS application was developed for managing landscape resources,
which allows the connection of all landscape bureaus of the city where data are
kept locally for maintenance and updates. This data are also available online to
the central bureau and other local bureaux. In 2004, the city authority of
Guangzhou, the capital city of south China, initiated the Digital Municipality
of Guangzhou (DigiM. GZ) project which aims to represent the Guangzhou
metropolitan area as a digitalised virtual municipality by using a wide range of
up-to-date GIS and telecommunications technologies. In Beijing, the Beijing
Digital Green Management Information System integrates a database of landscaping
areas and a database of social, economic, ecological and urban infrastructure.
The NSDI scheme in India (established in 2001) aims at using GIS to
merge satellite imagery and ancient topographic maps with data on water
resources, flooding, rainfall, crop patterns, and civic layouts to produce 3-D
digital maps. Another objective of the Indian NSDI is to achieve a national
coverage of all forest maps, land use, groundwater and wasteland maps, pollution
data, meteorological department’s weather-info and department of ocean
development’s sea maps. In 2005/06 in the Handni Chowk area of the walled city
of Delhi, a pilot study on generating a 3D-GIS database was accomplished. The
database was created by using a base map at scale 1:2,500, high resolution
satellite data, ground control points, video of the area, high resolution DEM
from LiDAR/ ALTM and by 3D GIS data processing and analysis software. In Mumbai
various GIS applications for small areas with different aims have been made. The
Mumbai Metropolitan Region Development Authority (MMRDA) recognised the
usefulness of this technology and thus proposes in its Regional Plan (1996–2011)
to build up a Regional Information System. These developments may be stimulated
by the Collective Research Initiative Trust (CRIT), which plans to generate an
open-access SDI and a set of simple tools and applications for knowledge
transfer and participatory urban planning by communities and citizens in Mumbai.
The Indonesian NSDI aims at improvement of coordination mechanism,
completion of spatial databases and national metadata developments, activation
of national clearinghouse and development of Digital Indonesia. The city of
Jakarta has a simple WebGIS application, which represents the road network of
the city and enables different search functions to find streets and points of
interest.
In Iran, national organisations, ministry and municipal offices as
well as private companies are active in the field of mapping and spatial data
production. The Tehran municipality, the Public and International Relations
Department has committed to the development of a WebGIS with more than 140
layers.
In Japan, the NSDI is implemented by the Geographical Survey Institute
(GSI), who with other ministries, began their work on the Spatial Data Framework
in 1995 and completed it in 2003. The future work of the Japanese NSDI
concentrates on a new infrastructure concept, which is promoted as “Digital
Japan” and which shall lead to a virtual and real-time representation of the
land. Concerning the two Japanese megacities Osaka and Tokyo, the internet
investigation could not extract any specific SDIinitiatives, although the survey
response from Tokyo indicated that base mapping and agency-specific spatial
applications do exist. Both cities developed long-term master plans where
principal goals for city planning are formulated, but no SDI strategy could be
identified.
In Pakistan no official NSDI was established. In its “Megacities
Preparation Project” from 2005 Karachi’s government schedules the development of
digital maps of the city by using GIS technologies.
First official activities for establishing an NSDI in Philippines were
initiated in 2001. As part of a developing country Metro Manila has not yet a
comprehensive SDI available. A disaster management information system called
“Metro Manila Map Viewer” was developed in 2004.
The first phase of an NSDI Master Plan for South Korea was completed
in 2000. Basic GIS infrastructure has been established by producing various
kinds of digital maps. The second phase of the NSDI, which started in 2001,
concentrated on spreading a GIS application for maintaining the digital maps and
developing national standards. The city of Seoul has at its disposal a
widespread SDI on the technical base of several distributed GIS applications
like Urban Planning Information System, Road Information System, Soil
Information System and other municipal affairs Information Systems. A Spatial
Data Warehouse is available which provides for sharing and accessing the
different spatial data of the GIS systems via a GIS portal system.
Development of the Thailand NSDI is part of the Thai Government’s
scheme for a comprehensive utilisation of information technologies to support
administration and public services. The key mechanism is the development of
e-Government in which GIS is a key component and plays an important role in
providing for dynamic information to support better governance of the country.
For the city of Bangkok there is a web page in Thai language that seems to grant
access to a comprehensive collection of spatial data in different GIS
applications.
3.3.3 SDI Application in the European Region
In France there is no explicit overall governmental initiative to
develop an NSDI even though a geoportal was launched in 2006 and a multitude of
NSDI-like initiatives are undertaken. In Paris a WebGIS application gives access
to the most important spatial data about the city. It is possible to access a
series of thematic maps through a multiplicity of data layers.
Russia’s NSDI concept schedules a three-stage process, which should be
finalised by 2015 with the implementation of the national NSDI. For the city of
Moscow no specific SDI solution information could be found during the internet
investigation.
There are several persisting problems in the field of SDI in Turkey:
lack of coordination between institutions; no standardisation, neither with
regard to the spatial reference system nor to data quality or data exchange;
data duplication; the majority of large scale data not available in digital
format; interoperability does not (yet) exist; lack of expert personnel and
budget; and a lot of difficulties to share data. Istanbul’s Water and Sewerage
Administration (ISKI) developed the Infrastructure Information System (ISKABIS)
to control and manage extensive water and wastewater facilities for the Istanbul
Metropolitan Area with more than 30 applications implemented. The city
administration of Istanbul provides a WebGIS, which represents the road network
for the metropolitan area of Istanbul containing a precise division into lots
and house numbers, orthophotos of different years and a range of thematic
information.
There is now a formal Location Strategy for the United Kingdom with a
single organisation responsible for its establishment and coordination. The
country as a whole has a well developed spatial information sector, with
extensive datasets available from both public and private sector sources. The
government of the city of London provides the City Online Maps Project Accessing
Spatial Systems (COMPASS), which aims at improving access to information about
London through a unique access point. One remarkable SDI application in London
is the Newham Neighbourhood Information Management System (NIMS), where users
gain access to data on economic, social and environmental conditions of the
borough.
3.3.4 SDI Application in the Pan-American
Region
In 2004 the National Geographic Information System of the Republic of
Argentina (PROSIGA) started as an online distributed GIS, in which seven
specific SDI working groups cover: institutional framework, policy and
agreements, fundamental and basic data, metadata and catalogues, diffusion and
communication, training, search engine for geographic names and information
technology for SDI. The Department of Geographic Information Systems of the city
administration of Buenos Aires developed a widespread WebGIS application built
up on open source components and integrating a multiplicity of spatial data
about the city. The GIS covers a range of applications like health, education,
tourism, sports, culture, leisure, green spaces, social services and
transportation, and enables access to information down to parcel units.
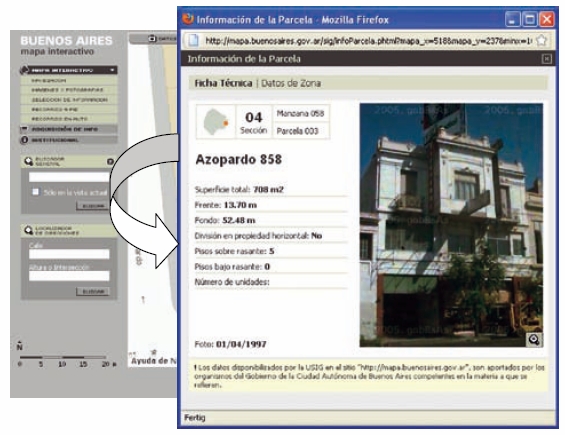
Figure 28: Public access to parcel information of the City of Buenos
Aires, Argentina. (Source:
http://mapa.buenosaires.gov.ar/sig/index.phtml)
The Brazilian cartographic community, in particular Federal Government
agencies, made great efforts to constitute an NSDI in Brazil. Map servers offer
diverse information and provide for spatial data of the whole country. The
department for planning of the city of Sao Paulo makes an online portal
available, which enables access to a multiplicity of statistical data, thematic
maps and allows for the visualisation of infrastructure data in a WebGIS client.
For Rio de Janeiro the department of city planning offers digital maps and
databases of the municipality of Rio in a geoportal and allows for download of
statistical tables, maps and spatial data.
The Mexican NSDI implementation has been led by the National Institute
of Geography, Statistics and Informatics (INEGI) since 1997. INEGI developed an
internet presence (GeoPortal), where users can view and download a series of
spatial data, including appropriate metadata. For the Mexican megacity Mexico
City the internet investigation did not find any specific SDI-like initiative.
The United States clearinghouse was established in 1994 with the US
Federal Geographic Data Committee (FGDC) given responsibility for NSDI
implementation. The NSDI major development focus is at the United States federal
level, although efforts have been made to support coordination at State level as
well. Spatial data is provided in a nationwide geoportal offering a multiplicity
of functions to access, publish and share spatial data in a widespread number of
categories. New York City has an interactive city map showing information on
transportation, education, public safety, resident service and city life. The
Office of Emergency Management operates a GIS, which maps and accesses a variety
of data from flood zones and local infrastructure to population density and
blocked roads – before, during, and after an emergency. Beyond that, the city
government runs a spatially-enabled public website called ‘ACCESS NYC’, which
has the capability to identify and display over 30 City, State, and Federal
human service benefit programs to explore appropriate services for individual
users needs. The Los Angeles city administration publishes a collection of
interactive maps containing information on traffic, parcels, flooding, city
services, leisure and other information.
3.4 Current Use of Spatial Information in City
Administrations
It was interesting to note that those senior administrators interviewed
during the study candidly admitted the importance of spatial data and analysis
in helping them do their job. As users of spatial information, they personally
believed that access to timely and accurate spatial data and tools was a key
requirement in managing functions such as city planning.
Correspondents to the study reported widespread use of spatial data in a
range of city functions, including:
- Land registration and tenure administration
- Cadastral survey, mapping and data management
- Policy development, planning and citizen engagement
- Land use and development control
- Transportation planning and road or highway management
- Public works, infrastructure development and maintenance
- Environmental protection
- Coastal, ports and marine management
- Law enforcement and security
- Public health management
- Visualisation of urban environment, demographic trends and social
conditions for use by elected officials and citizens
In fact, collection and usage is so widespread that data integration, access
and use was hampered by the diversity of data holdings and systems managed by
individual units. Getting data for planning processes, for example, can be
difficult, costly and slow. Fundamental data management standards were not being
used.
Access to data held by other levels of government was also problematic.
Collating data across internal units and external agencies was an impediment to
providing timely information to citizens.
All cities reported that they had at least some elements of an SDI. Most
cities reported that they had only small central GIS units, which were usually
under-resourced and so unable to develop a comprehensive citywide SDI. Missing
capabilities included no common metadata, spatial data policies and standards,
formal data sharing arrangements between units or agencies or shared data access
mechanism.
Most do not have a formal spatial data or GIS strategy across the whole
administration. However, most countries covered by this project have national
(and in some cases regional) SDI strategies. Unfortunately, at this stage it is
not clear to the study group what connection there is between national and local
strategies or how national strategies will meet the needs of cities.
Some cities have developed an intranet that could be used to access spatial
data held across multiple units.
The results of the survey and internet research show that several cities have
invested in providing access to spatial data as part of public websites that
report information about aspects of city administration such as land tenure,
use, planning, environmental and disaster management information. These could be
used as exemplars by other cities.
3.5 Empowerment of Citizens Through SDI
So far among the most sophisticated, implemented and operating spatial data
infrastructures in the European region, according to the INSPIRE principles, is
the Norwegian NSDI, with more than 210,000 reference and 50,000 thematic
datasets of standardised spatial data, available through a geoportal, and more
than 600 partners and 100 operational web map services (WMS).
Reference data includes topographic data, hydrography, roads and other
infrastructure, land-use, buildings and cadastral information, elevation and
bathymetry, and orthophoto layer. Thematic data includes a broad range of
information produced by national institutions and municipalities such as
demography, risk management, protected sites, biodiversity, pollution,
fisheries, geology, mineral resources, agricultural and forest resources,
cultural heritage and outdoor recreation facilities. Government’s priority is to
make everyday life simpler for the citizen and secure the future welfare. All
relevant interactive public services for the citizens are available through the
citizens’ portal “My Page” by 2009 (Figure 29).

Figure 29: Citizen Services on Norwegian MyPage Geoportal. (Source: Strande,
2009)
Data from a large amount of agencies with national coverage and from local
authorities, available on standard formats, are disseminated through WMS. On an
average there are about 200,000 downloads every day. All municipalities have
adopted a common ICT strategy to facilitate citizen participation in the
political decisions through electronic channels for dialogue among citizens, the
municipality and the politicians. WMS give better information exchange within
the organization and with the citizens in public hearings and makes it easier to
make inter-municipal map solutions. Through a specific tool that provides 3D
visualization of data, which is currently integrated in the Norwegian NSDI
interactive administrators’, citizens’, architects’ and property owners’
participation in the planning process and the natural resources management is
facilitated. The benefits of this initiative are well understood:
- Increased efficiency
- Accelerated procedures in case handling and building permitting
- Transparency in the planning process (e-democracy)
- Increased contact and more predictable processes for land owners and
other business
- Increased citizen influence on municipal planning
- Increased accessibility of information
As spatial planning and building permitting in Norway is a task under the
responsibility of the municipalities, it is now a requirement that the
municipalities should carry out risk and vulnerability mapping analysis. Each
municipality should prepare a list with the most typical risk and vulnerability
problems in its area, plus an overview of all relevant regulations e.g., for
water management, noise descriptions, security zones around industrial areas,
etc. Such maps and analyses are required at a more detailed level before
building permits are given. The municipality should guarantee that any spatial
planning and development permitting decision would not create risks for people,
environment and material values. It is important that risk information is easily
available when the building permit is handled, so new buildings are not located
in dangerous or ecologically fragile areas such as mudslide areas, and that
flood possibilities are taken into consideration (Figure 30).
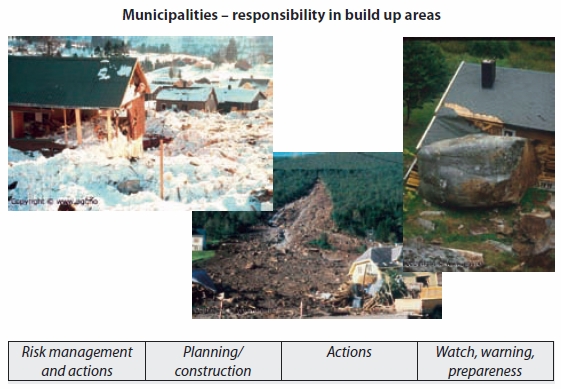
Figure 30: Risk Management under Norwegian City Management Responsibility.
(Source: Strande, 2009)
4. Added Value of SDI for City Administration
4.1 Solving Problems
Applying spatial information can help to solve problems in cities. For
example, Lagos Metropolis has emerged as one of the fastest urbanizing
cities in the West African Subregion. In the absence of a regular use of
information management systems, limited effort had been made to keep track of
change in the rapidly growing city for policy making in land administration. The
ubiquitous energy radiated by the rapid urbanisation rate in the area not only
created unprecedented consequences by diminishing the quality of the environment
but it raises serous implications for land management in the region. The factors
fuelling the land crisis in the area consists of socio-economic, ecological and
policy elements. To tackle these issues in a megacity, up-to-date knowledge
would be required to capture and analyse land information in order to control
the city’s expansion as well as infrastructure development and make
well-motivated choices in planning and (spatial) designs (Osei et al, 2006).
City governments are entrusted with the stewardship of land to ensure that it
is equitably exploited amongst a diverse set of users without compromising the
ability of future generations to meet their own needs for land. Decisions to
support the sustainable development of this land, as a valuable and finite
resource, merit an holistic approach to impact assessment. Many aspects and
options need to be explored to arrive at an appropriate, objective decision.
This can only be achieved if the decision makers, both city officials and
citizens, have access to consistent and integrated information about land. A key
element in providing this relevant land information is City-wide Land
Information Management (LIM), the institutional and technical arrangements
whereby information about all land and real property within a city are
administered.
Cities currently manage considerable collections of land related information.
However, the traditional separation of this information into different component
themes (Figure 31), combined with disjoint information management regimes, leads
to a considerable loss in the value of the information as a resource. A
city-wide SDI provides the means to technically and institutionally integrate
these component themes of land information into a truly corporate information
resource. The figure below illustrates how an SDI approach can add value by
combining information concerning use, condition, value and tenure of land and
disseminating this to the decision makers.
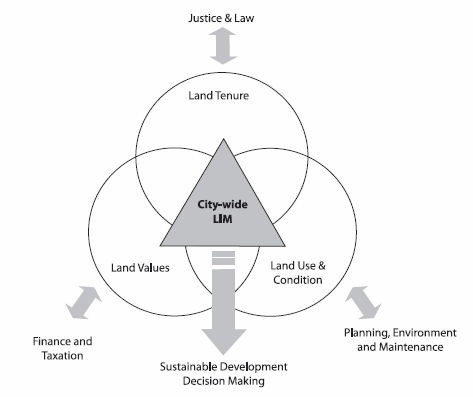
Figure 31: City-wide approach to supporting sustainable development
decision-making. (Source: FIG Publication No. 31
Land Information Management for Sustainable Development of Cities: Best Practice
Guidelines in City-wide Land Information Management, 2002)
The Marrakech Declaration (FIG
Publication No. 33) recommends the development of a comprehensive national land
policy, which should include:
- Institutional and governmental actions required for providing good
governance.
- Land administration infrastructures for steering and control of land
tenure, land value and land use in support of sustainable land management.
- Tools for capacity assessment and development at societal,
organisational and individual level.
This should in turn, form the basis for sound administration at local level.
While the focus has been on land administration, management of a city includes
other factors, such as public safety. So, while an SDI should provide the basis
for a good land administration system, it must also serve a range of city
management processes not necessarily dependent on use of land. For example, the
availability of a sound cadastral database covering spatial, legal and valuation
systems is a key element of an SDI; other data sets not necessarily based on
cadastral parcel are just as valid. Datasets can include census districts,
administrative units defining communities and government agency services, road
and utility service networks and natural feature boundaries.
There are a number of key issues faced by the growth of cities, which places
severe strains on their management. Key issues that need to be addressed and
possible use of spatial information are shown in table 6.
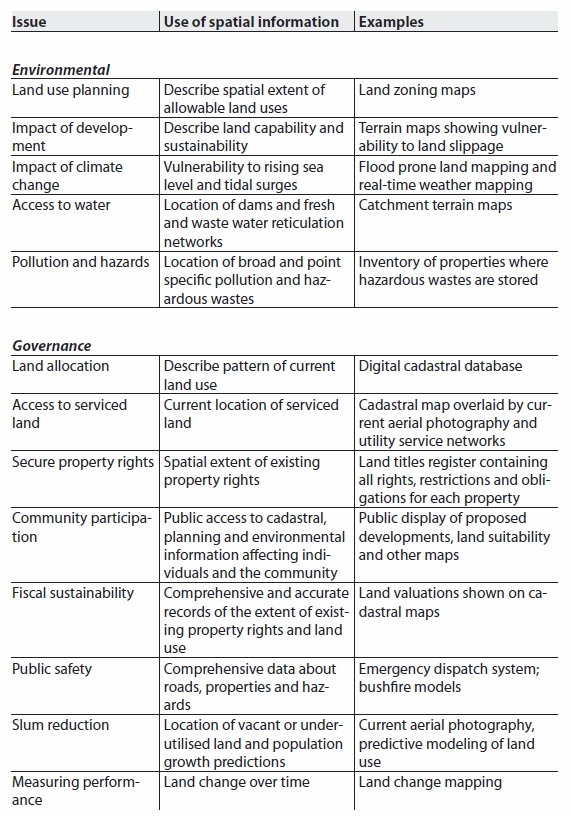
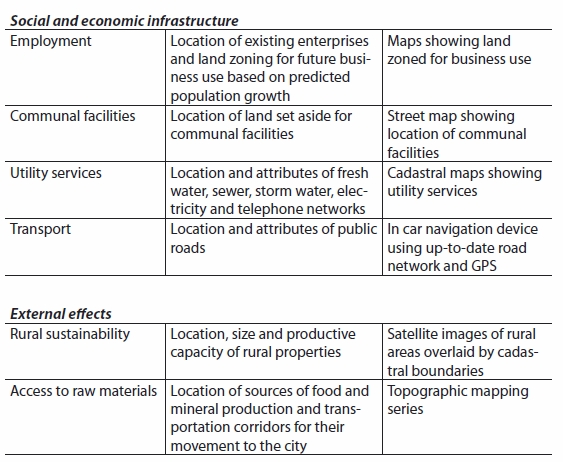
Table 6: Examples of use of spatial data and products in city
administration. (Source: Kelly, 2007).
4.2 Integrative Effect of SDI
An SDI is more than a collection of spatial data sets. It is also more than a
land administration system. SDI forms an underlayer of policies, administrative
arrangements and access mechanisms to allow integration of data from various
providers, systems and services to support end-to-end processes across
organizational and technology boundaries within a defined jurisdiction.
Some trends in SDI development include:
- Most countries recognise the value of spatial capabilities and are
developing SDI strategies at national and sub-national levels
- Key applications are disaster management, national security, natural
resource management and land administration
- City and local governments are a growing user of spatial information for
delivering community services
Public use is growing through navigation and online services. While
individual city governments are developing their SDI, experience shows that they
are more effective if they:
- Implement international best practice (such as use of ISO and OGC
standards)
- Use data from higher levels (such as regional cadastral database,
utility and transport network data and national topographic database)
- Provide end-to-end processes merged with surrounding jurisdictions (such
as regional planning processes and land use plans).
In fact, city level SDI should look like a microcosm of regional and national
SDI, perhaps differentiated by use of higher resolution data. City SDI should be
able to fit within SDI at other levels of government, using the same standards,
protocols and possibly access mechanisms. In turn, SDI at higher levels should
be able to seamlessly access and use the higher resolution data and capabilities
of city level SDI. Only in this way can duplication of effort between levels of
administration be avoided and seamless services provided to the primary users –
city managers and citizens.
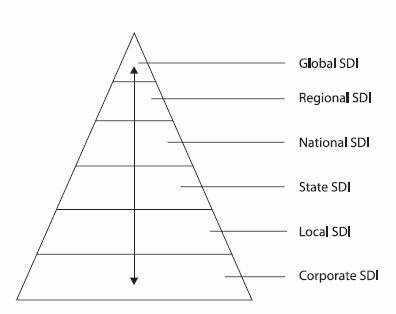
Figure 32: An SDI Hierarchy. (Source: Williamson, 2006)
5. Potential Strategies
5.1 Key Tools Needed to Address Problems
Some key tools needed to address megacity problems were identified by the
study.
These included:
- Strengthening planning laws to cover not just the planning process, but
the monitoring and implementation of the laws and to ensure that the
planning process is guided by economic and environment development strategy.
- Planning and development control over water catchments and other
sensitive areas affecting the city.
- Improved governance to provide good communication between all city units
and strong partnerships between the city administration and agencies at
other levels of government, especially in infrastructure development and
maintenance.
- Coordinated planning and implementation involving transportation,
utilities and other infrastructure providers.
- Working with the private sector to ensure financial and property markets
have the capacity to meet current and future needs for jobs and housing.
- A strong focus on disaster management, including coordinated planning,
preparation, response and recovery operations.
- In the developing world, a stronger focus was needed on good governance,
institutional development and capacity building.
- Encourage the voluntary use of crowdsourcing to capture spatial
information to complement the official sources.
- Ensure that aid agencies delivering projects within the cities provide
spatial data based on international standards.
It should be noted that the needs of cities in the developed and developing
world are significantly different.
5.2 Most Immediate SDI Needs
Correspondents identified some immediate requirements to support creation or
further growth of SDI in their cities. They have differing priorities and some
have already solved these problems. Those reported include:
- Completion of base mapping covering the city.
- Completion of conversion of base data into digital form.
- Common definitive street address file and integrated cadastral (legal,
fiscal and spatial) database.
- Solving internal institutional arrangements to provide access to
existing data held by individual units, preferably some type of policy or
edict setting up a formalised structure.
- Greater cooperation and cost sharing in new data collection, especially
with other levels of government.
- Obtaining stronger sponsorship for SDI development from senior city
officials and obtaining commensurate resources to do the job.
- A broader understanding within city administration units about the
benefits of integrating and using spatial information to do their job
better.
- Access to expertise in areas such as spatial data management and ICT to
build capacity for web-based repositories and access mechanisms, data
integration and spatial data products; (sometimes this is just a matter of
better access to existing people spread across units and sometimes need for
external help).
- Development of an agreed spatial data strategy, including data access
agreements, prioritisation of new data collection, sharing of resources, use
of common data standards and systems interoperability.
- A spatially-enabled one-stop citizen interface.
Experience in countries such as Australia shows that problems encountered in
developing an SDI at any level include:
- Immature institutional arrangements and user/provider relationships.
- Inconsistencies in the availability and quality of spatially referenced
data.
- Inconsistent policies concerning access to and use of spatially
referenced data.
- Incomplete knowledge about the availability and quality of existing
spatially referenced data.
- Lack of best practice in the utilisation of enabling technologies.
A detailed set of SDI procedures and strategies can be found in the SDI
Cookbook at
http://www.gsdi.org/docs2004/Cookbook/cookbookV2.0.pdf sponsored by the
Global Spatial Data Infrastructure Association (GSDI).
There are many good examples around the world of how spatial information and
technology are being used to improve planning and management of large cities.
The Ile de France region has offered the following case study as an example.
5.3 City Strategy of Greater Paris, France
The future development of the Ile de France region has recently been a source
of both intense work and political turmoil… Ile de France is the region centred
on the city of Paris. Its main characteristics are: 12 million inhabitants
(about 20% of France’s total population), 1,280 communes, 12,000 km² (about 2%
of the French territory); it combines both urban and rural activities, since 80%
of its area is dedicated to natural or agricultural use.
The spatial planning of this region has been done so far by the State, who
considered that this region was of national interest, therefore of its direct
responsibility. But France has been involved for the last twenty years in a
process of decentralization and empowerment of local authorities. In this
framework, the Ile de France region considered in 2004 that it should review the
last master plan set up by the State in 1994. It believed that this master plan
was outdated, particularly with regards to environmental challenges.
The process of setting up a new master plan started both as a political
process with a large consultation of stakeholders (city councils, departmental
councils, government, civil society, economic circles, and population), and as a
technical process. The region has entrusted its planning agency to draft master
plans, which reflected the outcome of the consultation process, and were used
for discussion purposes, until the regional council adopted the last version in
September 2008.
Concerning the main guidelines of this master plan, the region has
highlighted three main challenges until the year 2030:
- To favour the reduction of inequalities on the social and territorial
levels
- To anticipate climate and energy mutations
- To favour a dynamic economic development of the region in a global
economic environment.
- These challenges were translated into five major targets:
- To favour the building of 60,000 housing units per year until 2030
- To create 700,000 additional jobs and to diversify the economy
- To favour the development of public transportation means, around which
additional urbanisation should take place
- To preserve and to support natural and agricultural resources, including
by the densification of urban areas (more inhabitants and housing units per
km²)
- To provide better services and infrastructure for the population (better
quality of life).
The master plan was criticised by the government as being insufficiently
ambitious and therefore, it did not get the required approval, nor was it
enforced. However, the master plan remains a very useful source of information
and an exciting example of a comprehensive approach of these regional problems,
assessed in the spirit of SDI. Below are some maps illustrating the outcome of
this work. (Source: Paris master plan project 2008; French acronym: SDRIF.)
Figure 33 shows the spots where additional housing should be undertaken, with
not less than 30% of social housing.
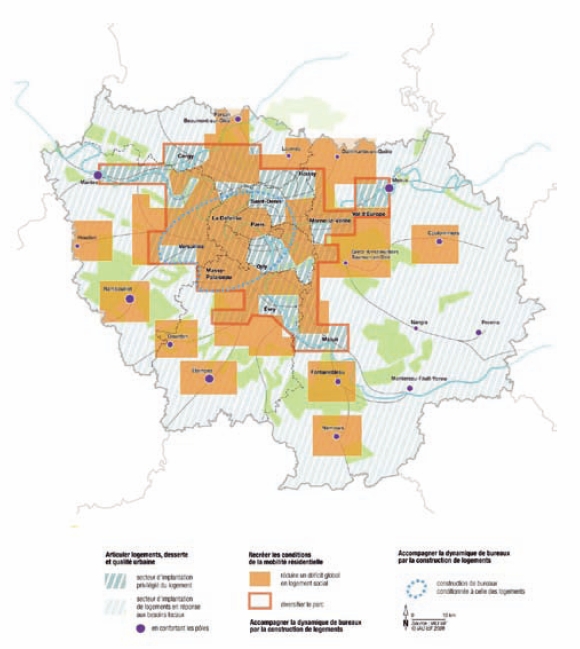
Figure 33: The Greater Paris master plan project – housing. (Source: SDRIF,
2008)
All these maps have been produced by the engineering and urban planning
institute set up by the region, under the name of “Institut d’Aménagement et
d’Urbanisme – Ile de France” (IAU-IdF): This agency has a total staff of about
200 persons, in a number of disciplines, and it provides information and
guidance to the political bodies involved in the planning of the region.
The agency describes its scope of activities as follows:
- A global conception of planning including: Master plan, green scheme,
regional development plan for tourism, landscape scheme, town-planning
policy, free urban zones.
- Environment and sustainable development including: Understanding
different environments, green belt, nature reserves, resources, nuisances,
remote sensing.
- Population including: Demography, education and training, health,
housing, leisure activities, culture, heritage.
- Economy including: Economic fabric, employment, land, finances of local
government entities.
- Transportation including: Trip management plans, transportation and city
accessibility for the disabled, traffic calming schemes, impact on the
environment.
In order to provide appropriate data and reports, it has a multidisciplinary
know-how which illustrates its comprehensive approach of planning challenges,
linked to geographic information, in the spirit of SDI. Its contents include:
- Regional and local information, which is regularly updated
- Processing and analysis of files from national or regional surveys
(housing, employment, transport…)
- Production of inventories (natural resources, underprivileged urban
areas, education, land use laws, health…)
- Upgrading various cartographic and databanks
- A regional geographical information system (RGIS)
- Prospective works to support future strategic issues
- Management charts to follow up the master plan
- Multi-disciplinary teams and grassroots input from architects, urban
planners, specialist engineers (agricultural engineers, computer scientists
and transport technicians…), economists, demographers, geographers, experts
in the areas of law, the environment, health, documentation….
Such a multidisciplinary approach linked to a geographic based approach, with
a guaranteed sustainability, fits well with the spirit of an SDI at regional
level, which provide probably the most advanced level of SDI in France.
Figure 34 shows the transportation priorities at regional level. A clear
priority should be given to public transportation at the expense of the
individual car for evident environmental reasons. Development of regional
railway lines, favouring lateral ways of transportation thus avoiding the Paris
centre are among the most prominent recommendations. Figure 35 presents all
stations in service and planned for the purpose of water sanitation.
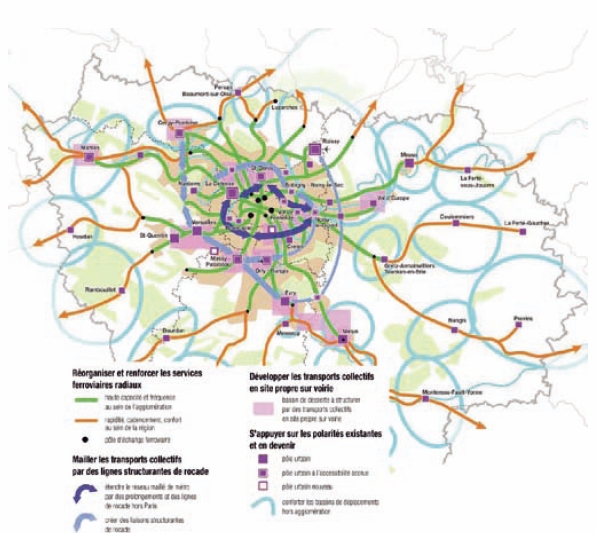
Figure 34: The greater Paris master plan project – transportation. (Source:
SDRIF, 2008)
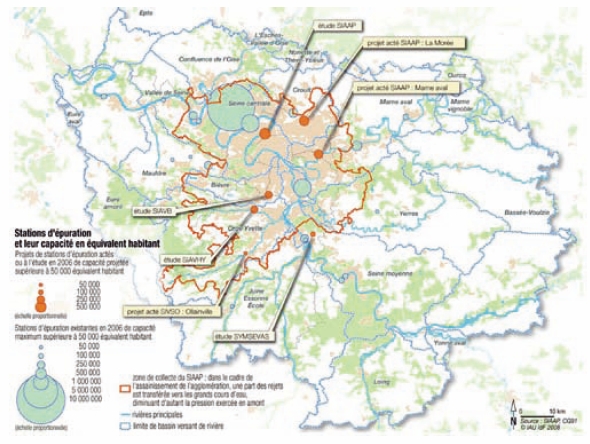
Figure 35: The greater Paris master plan project – water sanitation.
(Source: SDRIF, 2008)
Figure 36 shows regional policies. Densification of the urban areas is a
major target, with additional urbanisation allowed mainly along the railway
lines.
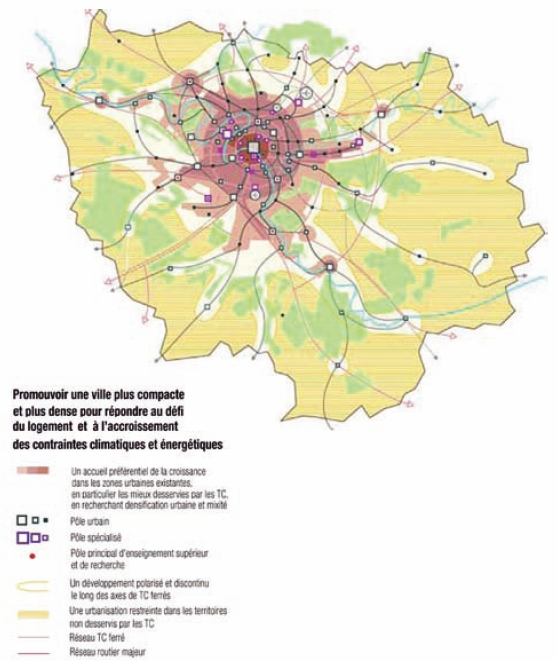
Figure 36: The greater Paris master plan project – regional policies.
(Source: SDRIF, 2008)
In Figure 37, strategic geography identifies the areas whose dynamism is
fundamental to the region, and those areas with a potential role in the regional
dynamics, provided that appropriate investments are done.
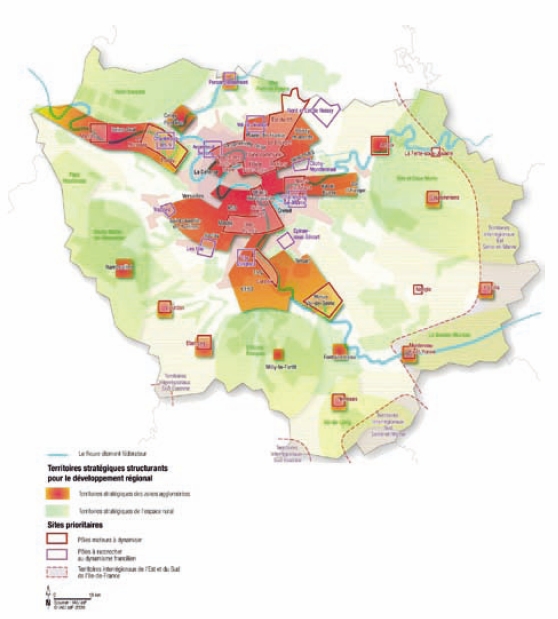
Figure 37: The greater Paris master plan project – regional dynamics.
(Source: SDRIF, 2008)
6. Conclusions
Urbanisation
- Urbanisation is a major change that is taking place globally. The urban
global tipping point was reached in 2007 when over half of the world’s
population was living in urban areas, around 3.3 billion people. There are
currently 19 megacities (population of over 10 million) and there are
expected to be 27 by 2020.
- This rapid growth of megacities causes severe ecological, economical and
social problems. 30% of urban populations in developing countries live in
slums or informal settlements.
- Rapid urbanisation is setting the greatest test for land professionals
in the application of land governance to support and achieve the Millennium
Development Goals (MDGs).
Problems to be managed within Megacities
- Administrations in large cities are often confronted with a multitude of
key problems, like high urban densities, inadequate transport, traffic
congestion, energy inadequacy, unplanned development and lack of basic
services, illegal construction both within the city and in the periphery,
informal real estate markets, creation of slums, poor natural hazards
management in overpopulated areas, crime, water, soil and air pollution
leading to environmental degradation, climate change and poor governance
arrangements.
- Further population growth is inevitable. Monitoring population change
effectively and responding through planning and infrastructure development
will be major challenges.
City Governance
- Many cities and their areas of influence have problems with unclear and
overlapping responsibilities amongst internal and external agencies, leading
to operational dysfunction such as a multitude of agencies holding
non-accessible spatial information. Mandates might be clear, but
rationalisation of functions and more effective levels of cooperation and
information sharing are needed.
- Where city planning is centrally coordinated, city administrations often
have little control over the implementation (i.e. land use and building
controls) of their policies and plans.
- Spatially enriched web based services are providing new opportunities to
more closely involve citizens in consultations and land administration
functions.
Spatial Information to Manage Megacities
- Access to spatial information has become indispensable for numerous
aspects of urban development, planning and management. The increasing
importance of spatial information has been due to recent advances in spatial
information capture (especially satellite remote sensing and GNSS),
management (utilising GIS and database tools) and access (witness the growth
in web mapping services), as well as the development of analytical
techniques such as high resolution mapping of urban environments. These more
efficient techniques have lead to a wider diversity of information that is
more up-to-date.
- The challenge is for users both within and outside these areas of
activity to break down the information silos and to discover, to access and
to use this information to improve decision-making, business outcomes and
customer services.
- There is a general lack of knowledge amongst communities of practice
about what spatial solutions exist and how they can be used and prioritised.
- In megacities within developing countries, where informal settlements
are the norm, growth is rampant and administrative structures limited, then
traditional sources of location information and change intelligence is not
readily available.
Spatial Data Infrastructures (SDI) for Megacities
- The visionary concept of using an SDI to more efficiently manage, access
and use spatial information in megacities is evolving; megacities are at
different stages of implementation of SDI use. All cities have different
interpretations of what constitutes an SDI, but most reported that they had
at least some elements of an SDI. However, most cities have no strategic
framework to guide and create their SDI. Missing capabilities included no
spatial data policies and standards, common metadata, formal data sharing
arrangements between units or agencies, or shared data access mechanisms.
- At this stage it is not clear what connection there is between national
and local strategies for SDI use or how national strategies will meet the
needs of cities. Innovative Uses of Spatial Information Tools to Manage
Megacities
- New tools, techniques and policies are required to baseline and
integrate the social, economic and environmental factors associated with
megacities – all within shorter timeframes than previously accepted.
Moreover, they must be flexible enough to meet traditional needs, e.g. land
administration functions, but be designed to be interoperable and integrate
within the city wide SDI to also support the management of key problems such
as disaster management, environmental management, health and transportation.
Encouragement of economic development and reduction of social inequalities
may also be addressed by the new tools and techniques of SDI applications.
- These spatial information tools include:
Data collection & maintenance – high resolution satellite imagery
(< 0.5m) is now commercially available at an affordable rate from a number
of sources with repeat coverage at a frequency greater than required for
this application. This opens up the possibility to efficiently generate
topographic and thematic mapping (at a scale of at least 1:5,000) and to
better understand changes across the city, e.g. sporadic creation of
informal settlements. This process is being made more effective with
emerging automatic feature extraction techniques. Other tools including
digital aerial photography, LiDAR, low cost GNSS devices on smart phones and
automated field surveying are revolutionising how spatial information can be
quickly captured.
Data integration and access – ISO / OGC / WWW interoperable
information and services standards allow the possibility of the real-time
merging of data and services (plug and play) from a variety of sources in
the city. This will be achieved through the creation of shared web
information services to allow users access to the wide range of information
held by different agencies of the city. This will be instrumental in
breaking down the information silos and will lead to the innovative re-use
of spatial information.
Data analysis – data mining and knowledge discovery techniques
allow the integration of a wide range of spatial information and associated
attribute information. These create an opportunity to perform more effective
forms of analysis in decision-making and leads to more cost-effective
solutions, e.g. targeting of limited city resources for health care and
maximising the economic benefits of investments in transportation systems.
3-D city modelling – many applications are enhanced by the use of
3-D spatial information, e.g. visualisation of planning development
proposals, flooding predictions, modelling population growth, tourist visit
simulations and the design of transportation networks. 3-D spatial
information of the natural and built environments are increasingly
available, e.g. through terrestrial LiDAR, making many of these applications
operationally viable.
Citizen centric urban sensing – The new generation of urban
sensors, including cellular phones, has potential for providing managers
with access to a range of current spatial and environmental information
about the evolving activities of their megacities. By these means people
could voluntarily provide information about changes to their environment.
This has the potential to increase the levels of citizen participation in
the governance of megacities and to help to fill the current gaps in urban
information needed to understand the dynamics of megacities. At the national
level, no country has so far generated data management policies that truly
integrate and utilise this new approach. Citizen participation in data
collection must be voluntary and data collection methods must be transparent
and open to public understanding
Spatial Information Policy Constraints
- Advances in developing megacity SDI will only occur when senior
management are convinced of the benefits through experience derived from
business case studies and only when SDI implementation is guided by a
supportive megacity information strategy. However, it is difficult to
achieve this type of strategy in the complex multi-layer governance
structures of the megacities.
- As spatial information is used more commonly with more citizen
awareness, there is a risk of popular mistrust concerning privacy issues. It
is therefore essential that policy frameworks are established legally for
the appropriate use of spatial information. It is also important to raise
public awareness about the benefits citizens will enjoy through SDI, mainly
due to increased transparency in city governance; and the opportunity for
public participation in decision-making.
- It must be recognised that citizen participation in information
gathering suggests certain risks like the concern for privacy; suspicion of
governmental intrusion and loss of public support; the issue of quality of
data collected by non professionals and the need for quality analysis; the
danger of miss-use of citizen-provided information by repressive
governments; and the question of the capacity of governmental agencies to
monitor, evaluate, and interpret the volumes of data collected in certain
urban sensing systems.
7. Recommendations
1. Widen the awareness of rapid urbanisation with land professionals,
and FIG members in particular, to better achieve solutions.
Rapid urbanisation is a global issue that is presenting the greatest test
for land professionals in the application of land governance to support and
achieve the MDGs and to mitigate the negative social, economic and
environment consequences of this development. An awareness programme for
land professionals, especially FIG members, is required to ensure that land
professionals can respond to and help resolve issues such as climate change,
food shortage, energy scarcity, environmental pollution, infrastructure
chaos and extreme poverty increasingly prevalent in urbanisation.
2. Present the benefits of SDI to megacity management to accelerate
their implementation.
Investment in the use of spatial information and the development of
megacity SDI will only occur if there are good practice examples. Further
research is required to gather evidence on the range of benefits to justify
these investments. This evidence should then be shared to allow megacities
to strengthen their action plans for investment. Opportunities provided by
spatial information and SDI’s should be exposed to all stakeholders,
especially civil society, to organize users for common demand.
3. Include spatial information best practice in the agenda of relevant
international bodies to promote the benefits of SDI.
Several global organisations support the agendas of the megacities; such
as UN-Habitat, leading bodies in the spatial professions and urban-focussed
forums like Metropolis. FIG should work in partnership with these key
organisations to ensure that the role and benefits of use of spatial
information and development of SDI is understood within the megacities
communities to encourage their adoption and exploitation.
4. Highlight the value of spatial information tools to megacity
professionals to encourage their adoption.
The study has found that spatial information technology is being
recognised widely as one of the tools needed to address pressing urban
problems, but there is still a general lack of knowledge amongst communities
of practice about how spatial information solutions can be applied.
Knowledge transfer, especially amongst practitioners in city
administrations, is a key requirement. A sharing of case studies to
demonstrate current best practice in selected cities is a way to show other
cities what is possible.
5. Apply interventions to informal settlements in the context of wider
economic and social policies to provide scalable, sustainable solutions.
The solutions for reducing informal settlements in many cities will only
be achieved through a range of appropriate interventions being applied
within the broader context of economic growth and poverty reduction
policies. To achieve solutions around this combined and complementary policy
approach it is essential that spatial information be integrated and analysed
with wider economic and social information. It is recommended that
information strategies and standards are developed to achieve this more
holistic approach to information management in megacities.
6. Create a megacity spatial information strategy to guide the
development of a megacity SDI.
Spatial information should not be considered a separate information asset
to be managed in isolation within megacities. Guidelines on spatial
information need to be tightly integrated into the overall ‘corporate’
information strategy and informed by national spatial information
interoperability standards. This ‘corporate’ approach will facilitate
collaboration and multi-professional solutions to problems. Best practice in
information strategies should be shared among megacities.
7. Open access to the megacity SDI to civil society to support
participatory democracy.
The creation of megacity SDI and spatially enabled web services can
provide citizens with direct access to megacity information and to support a
dialogue with the megacity administration. It is recommended that megacities
should open these channels to the citizens and provide web based access to
information and services, wherever possible, to increase transparency,
facilitate business and improve citizen participation to decision-making.
8. Extend the skills of all professionals involved in megacities to
enable the increased exploitation of spatial information tools.
Too often the skills surrounding the use of spatial information tools is
limited to a small group of what are usually called ‘GIS experts’. This
severely limits the understanding and use of these valuable tools across
megacity organisations. It is recommended that training programmes on
spatial information tools are developed for a wide range of professionals
across megacities to create a self-service model.
9. Proactive information to manage complex and dynamic urban
environments.
The traditional approaches to the capture and maintenance of spatial
information in megacities involve a static view of what layers of spatial
information are captured and their quality (often high and expensive).
Spatial information is normally maintained on a cyclical basis. In the
context of many megacities, this traditional paradigm may be inadequate in
the near future. Consequently it may be necessary for these megacities to
develop and adopt a complementary spatial information management strategy
that in the short term will apply additional spatial information tools,
techniques and policies to more effectively monitor and model growth and
change in the urban area to improve city governance. The outputs must be
achieved within shorter timeframes than in the traditional approaches and be
much more supportive of the most immediate information needs and priorities
of each megacity.
- Abo Akel N., Filin S., Doytsher Y., 2009. “Reconstruction of Complex
Shape Buildings from LiDAR Data Using Free Form Surfaces”. Photogrammetric
Engineering and Remote Sensing, 75(3):271–280.
- Abdulharis R., van Loenen B., Zevenbergen B., 2005. “Legal Aspects of
Access to Geo-Information within Indonesian Spatial Data Infrastructure”.
ISPRS Workshop on Service and Application of Spatial Data Infrastructure,
XXXVI (4/W6).
- Albites F.A.H., 2008. “Relationships of Cartography, Geographic
Information Systems and the Mexican Spatial Data Infrastructure (IDEMEX)”.
International Archives of the Photogrammetry, Remote Sensing and Spatial
Information Sciences, XXXVII(B4).
- Albrecht K. 2008. “RFID Tag – You’re It”. Scientific American, 299(3):
48–53.
- Albrecht K., McIntyre L., 2006. “Spychips: How Major Corporations and
Governments Plan to Track Your Every Move”. Published by Plume (Penguin),
Oct. 2006, ISBN 0452287669.
- Alharty A., Bethel J., 2004. “Detailed Building Reconstruction from
Airborne Laser Data Using a Moving Surface Method”. International Archives
of Photogrammetry and Remote Sensing, 35(B3):213–218.
- Altan O., 2009. “Role of Geospatial Professionals in Risk and Disaster
Management and Preventing Natural Catastrophies”. Proceedings of the FIG
Working Week 2009, Eilat, Israel,
http://www.fig.net/pub/fig2009
- Arief Syafi’I M., 2006. “The Integration of Land and Marine Spatial Data
Set as part of Indonesian Spatial Data Infrastructure Development”, 17th
United Nations Regional Cartographic Conference for Asia and the Pacific,
Bangkok.
- Asmat A., 2008. “Potential of Public Private Partnership for NSDI
implementation in Pakistan”. Master-Thesis, ITC, Enschede, the Netherlands.
- Avrahami Y., Raizman Y., Doytsher Y., 2008. “A Polygonal Approach for
Automation in Extraction of Serial Modular Roofs”, Photogrammetric
Engineering and Remote Sensing, 74(11):1365–1378.
- Baktash P., 2003. “National and Regional Spatial Data Infrastructure
(NSDI & RSDI) and National Cartographic Center of Iran’s Activities about
it”. Proceedings of the 2nd FIG Regional Conference, Marrakech, Morocco.
- Baltsavias E.P., 2004. “Object Extraction and Revision by Image Analysis
Using Existing Geodata and Knowledge: Current Status and Steps towards
Operational Systems”. ISPRS Journal of Photogrammetry & Remote Sensing,
58(3–4):129–151.
- Baltsavias E.P., Mason S., Stallmann D., 1995. “Use of DTMs/DSMs and
Orthoimages to Support Building Extraction”, Grün A., Kübler O., Agouris P.
(Eds), Automatic Extraction of Man-Made Objects from Aerial and Space
Images, Birkhäuser Verlag, Basel, Switzerland, pp. 199–210.
- Barsi A., 2004. “Object Detection Using Neural Self-Organisation”.
International Archives of the Photogrammetry, Remote Sensing and Spatial
Information Sciences, Istanbul, Turkey, XXXV(B3):366–371.
- Bellman C.J, Shortis M.R., 2004. “A Classification Approach to Finding
Buildings in Large Scale Aerial Photographs”. International Archives of the
Photogrammetry, Remote Sensing and Spatial Information Sciences, Istanbul,
Turkey, XXXV(B3).
- Blaschke T., Lang S., Lorup E., Strobl J., Zeil P., 2000.
„Object-Oriented Image Processing in an Integrated GIS/Remote Sensing
Environment and Perspectives for Environmental Applications“, Cremers A.,
Greve K. (Eds.), Environmental Information for Planning, Politics and the
Public, Vol. II, Metropolis-Verlag, Marburg, pp. 555–570.
- Boos S, Müller H., 2009. „SDI Developments in the World’s Currently
Existing Mega Cities“.
http://www.fig.net/pub/monthly_articles/april_2009/april_2009_boos_mueller.html,
FIG Article of the Month, April 2009.
- Boucelma O., Essid M., Lacroix, Z., 2002. «A WFS-Based Mediation System
for GIS Interoperability ». Proceedings of the 10th ACM international
symposium on Advances in geographic information systems (ACM-GIS), pp.
23–28.
- Busch A., 1998. “Revision of Built-Up Areas in A GIS Using Satellite
Imagery and A GIS”. International Archives of the Photogrammetry, Remote
Sensing and Spatial Information Sciences, Stuttgart, Germany,
XXXII(4):91–98.
- Chen C., Knoblock C.A., Shahabi C., 2006. “Automatically Conflating Road
Vector Data with Orthoimagery”. GeoInformatica 10 (4): 495–530.
- Cheng R., 2008., “Fighting Traffic Jams With Data”, Wall Street Journal,
17th November 2008.
- Cho M.G., Li K.J., Cho H.G., 1996. “A Rubber Sheeting Method with
Polygon Morphing”. Proceedings of the Seventh International Symposium on
Spatial Data Handling, Advances in GIS Research II, pp. 395–406.
- Clinton W., 1994. “Coordinating Geographic Data Acquisition and Access:
The National Spatial Data Infrastructure”, Executive Order 12906, April 13,
1994, Federal Register, 59 (71): 17671–17674.
- Cobb M.A., Chung M.J., Foley H., Petry F.E., Show K.B., 1998. “A
Rule-Based Approach for Conflation of Attribute Vector Data”.
GeoInformatica, 2, 7–33.
- Cuff D., Hansen M., King J., 2008. “Urban Sensing: Out of the Woods”.
Communications of the ACM, 51(3): 24–33.
- Devogele T., Parent C., Spaccapietra S., 1998. “On Spatial Database
Integration”. International Journal of Geographical Information Science
(IJGIS), Special Issue on System Integration, 12: 335–352.
- Doytsher Y., 2000. “A rubber sheeting algorithm for non-rectangular
maps”. Computers & Geosciences, 26(9–10):1001–1010
- Doytsher Y., Filin S., Ezra, E., 2001. “Transformation of Datasets in a
Linear-Based Map Conflation Framework”. Surveying and Land Information
Systems, 61: 159–169.
- Doytsher Y., Dalyot S., 2009. “Producing Seamless Multi-Source
Quality-Dependent Digital Terrain Models”. Proceedings of the 7th FIG
Regional Conference, Hanoi, Vietnam,
http://www.fig.net/pub/vietnam/papers/ts02e/ts02e_doytsher_dalyot_3590.pdf.
- Doytsher Y., Dalyot S., Katzil Y., 2009. “Digital Terrain Models: a Tool
for Establishing Reliable and Qualitative Environmental Control Processes”.
GeoSpatial Visual Analytics: Geographical Information Processing and Visual
Analytics for Environmental Security, Raffaele De Amicis, Radovan
Stojanovic, Giuseppe Conti (Eds.), Springer Science and Business Media, pp.
215–234, ISBN 978-90-481-2897-6.
- Economic Studies Division of Alpha Bank, 2007. “Environmental
Protection: For a Longterm Sustainable Development”. In: Economic Report of
Alpha Bank, 103: 3–21, URL:
http://www.alpha.gr/files/infoanalyses/oikon_deltio_103.pdf (in Greek).
- Enemark S., 2007. “Integrated Land-Use Management for Sustainable
Development”. Proceedings of the Joint FIG Commission 3, UN/ECE Working
Party on Land Administration and UN/ECE Committee on Housing and Land
Management Workshop, Sounio, Greece.
- Enemark S., 2009. “Facing the Global Agenda-Focus on Land Governance”.
Proceedings of the FIG Working Week 2009, Eilat, Israel,
http://www.fig.net/pub/fig2009.
- Enemark S., McLaren R., 2008. “Preventing Informal Development – through
Means of Sustainable Land Use Control”. Proceedings of the FIG Working Week,
Stockholm,
http://www.fig.net/pub/fig2008/papers/ts08a/ts08a_01_enemark_mclaren_2734.pdf.
- Enemark S., Williamson I., Wallace J., 2005. “Building Modern Land
Administration Systems in Developed Economies”. Journal of Spatial Science,
50(2): 51–68.
- European Union, 2007. “Directive 2007/2/EC of the European Parliament
and of the Council of 14 March 2007 Establishing an Infrastructure for
Spatial Information in the European Community (INSPIRE)”. Official Journal
of the European Union, L108:1–14.
- Filin S., Pfeifer N., 2006. “Improved Segmentation of Airborne Laser
Surfaces Using Adaptive Distance Based Neighborhood”. ISPRS journal of
Photogrammetry and Remote Sensing, 60(2):71–80.
- Gabbay M., 2004. “Developing Procedures for an Automatic Conflation
between Vectorial Datasets of Geographic Information”, PhD Dissertation,
Technion, Israel.
- Gerke M., Heipke C., Straub B.M., 2001. “Building Extraction from Aerial
Imagery Using a Generic Scene Model and Invariant Geometric Moments”.
Proceedings of the IEEE/ISPRS joint Workshop on Remote Sensing and Data
Fusion over Urban Areas, University of Pavia, Rome, Italy, pp. 85–89.
- GISdevelopment, 2007. “3D GIS System for Monitoring Illegal
Constructions in India’s Capital City to Be Implemented Fully by Next Year”.
URL:
http://www.gisdevelopment.net/news/catapp.asp?sub=UrbanPlanning.
- Gruen A., 1997. “Automation in Building Reconstruction”.
Photogrammetrische Woche, pp. 175–186,
www.ifp.uni-stuttgart.de/publications/phowo97/gruen.pdf.
- Gruen A., Wang X., 2001. „News from CyberCity Modeler“. Automatic
Extraction of Man-Made Objects from Aerial and Space Images (III), Balkema
Publishers, Lisse, The Netherlands, pp: 93–101.
- Gruen A., Wang X., 1998. „CC-Modeler: A Topology Generator for 3D City
Models“. ISPRS Journal of Photogrammetry & Remote Sensing, 53(5): 286–295.
- Gulch E., Muller H., Labe T., 1999. „Integration of Automatic Processes
into Semi-Automatic Building Extraction“. International Archives of
Photogrammetry and Remote Sensing, 32(3–2W5):177–186.
- Guo T., Yasuoka Y., 2002. “Snake-Based Approach for Building Extraction
from High-Resolution Satellite Images and Height Data in Urban Areas”.
Proceedings of the 23rd Asian Conference on Remote Sensing. Kathmandu,
Nepal, unpaginated CD-ROM.
- Habib A., 2009. “Integration of Photogrammetric and LIDAR Data for
Accurate Reconstruction/Visualization of Urban Environments”. Proceedings of
the FIG Com3 Workshop on Spatial Information for Sustainable Management of
Urban Areas, Mainz, Germany.
- Hahn M., Stätter C., 1998. “A Scene Labeling Strategy For Terrain
Feature Extraction Using Multisource Data”. International Archives of the
Photogrammetry, Remote Sensing and Spatial Information Sciences, Colombus,
USA, XXXII(3/1): 435–441.
- Han S., Cho H., 2001. “Development of National Spatial Data
Infrastructure in Korea”, Proceedings of the FIG Working Week. Seoul, South
Korea.
- Hofmann P., Strobl J., Blaschke T., Kux H., 2006. “Detecting Informal
Settlements from Quickbird Data in Rio De Janeiro Using an Object Based
Approach”. International Archives of the Photogrammetry, Remote Sensing and
Spatial Information Sciences, Salzburg, Austria, XXXVI(4/C42), unpaginated
CD-ROM.
- Hurskainen P., Pellikka P., 2004. “Change Detection of Informal
Settlements Using Multi-Temporal Aerial Photographs – The Case of Voi,
SE-Kenya”, Proceedings of the 5th African Association of Remote Sensing of
the Environment conference, Nairobi, Kenya, unpaginated CD-ROM.
- Ioannidis C., Psaltis C., Potsiou C., 2009. ”Towards a strategy for
control of suburban informal building through automatic change detection”.
Journal of Computers, Environment and Urban Systems (CEUS), 33(1): 64–74.
- Jacobsen K., 2005. “Photogrammetry and Geoinformation Trends in Large
Scale Mapping”. Proceedings of the 1st Annual Map Middle East Conference,
Geospatial information and knowledge economy, Dubai, UAE, unpaginated
CD-ROM.
- Jacobsen K., 2006. “Very High Resolution Optical Space Sensors –
Overview, Accuracy and Information Contents”, General Organisation of Remote
Sensing, 15th International Symposium, Remote sensing and assisting systems,
Damascus, Syria, unpaginated CD-ROM.
- Jin X., Davis C.H., 2005. “Automated Building Extraction from
High-Resolution Satellite Imagery in Urban Areas Using Structural,
Contextual, and Spectral Information”. EURASIP Journal on Applied Signal
Processing, 14: 2196–2206.
- Karanja F.N., 2002. “Use of Knowledge Based Systems for the Detection
and Monitoring of Unplanned Developments”, PhD Thesis, Institute of
Photogrammetry and Engineering Surveys, University of Hannover, Hannover,
Germany.
- Karavassili M, 2004. “Procedure Simplifications to Facilitate
Application of Urban Planning and Environmental Legislation through Control
Mechanisms and Inspections”. Proceedings of the Workshop on Urban Planning
and Construction, Athens, Greece, Technical Chamber of Greece (in Greek).
- Katzil Y., Doytsher Y., 2005. “Spatial Rubber Sheeting of DTMs”.
Proceedings of the 6th Geomatic Week Conference, Barcelona, Spain.
- Kelly P., 2007. “Role of Spatial Data Infrastructures in Managing Our
Cities”. Proceedings of the FIG Commission 3 Annual Meeting, Sounion,
Greece.
- Kelly P., 2008. “Commission 3 at the 9th Congress of Metropolis”. URL:
http://www.fig.net/news/news_2008/sydney_oct_2008.htm.
- Kelly P., 2008. “Current Problems and Issues in Using SDI in Mega
cities”, Report of FIG Working Group 3.2: Spatial Data Infrastructures in
Megacities, unpublished.
- Kötter T. 2004. “Risks and Opportunities of Urbanisation and
Megacities”. Proceedings of the FIG Working Week, Athens, Greece,
http://www.fig.net/pub/athens/papers/ps02/ps02_2_kotter.pdf.
- Laurini R., 1998. “Spatial Multi-Database Topological Continuity and
Indexing: A Step Towards Seamless GIS Data Interoperability”. International
Journal of Geographical Information Science, 12(4):373–402.
- Laurini R., Yetongnon K., Benslimane D., 2002. “GIS Interoperability,
from Problems to Solutions”. Encyclopedia of of Life Support Systems (EOLSS)
(Eolss Publishers).
- Lavedan P., 1926. “Histoire de l’ Architecture Urbaine”, t.1, H.
Laurence, Paris.
- Leobet M., 2009. «Implementing INSPIRE in Real Life: the French Case»,
Spatial Information National Council Meeting, GSDI, June 2009, CNIG/LBT.
- Leading Edge Forum 2008, 2008. “Digital Disruptions, Technology
Innovations Powering the 21st Century Business”, URL:
http://www.csc.com/features/stories.
- Li P., Lan W., Xuenian X., 2008. “SDI in China: Progress and Issues”.
International Archives of the Photogrammetry, Remote Sensing and Spatial
Information Sciences, XXXVII(B4).
- Martin R., 1956. “L’ Urbanisme dans la Grece Antique”, A & J. Picard,
Paris.
- Marwaha A., 2008. “Web Tool Maps Congo Conflict”, BBC Website,
http://news.bbc.co.uk/1/hi/technology/7773648.stm.
- Mayer H., 1999. “Automatic Object Extraction from Aerial Imagery – A
Survey Focusing on Buildings”. Computer Vision and Image Understanding, 74:
138–149.
- Mayer H., 2004. “Object Extraction for Digital Photogrammetric
Workstations”. International Archives of the Photogrammetry, Remote Sensing
and Spatial Information Sciences, Istanbul, Turkey, XXXV(B2): 165–173.
- McLaren R., Mahoney R., 2000. “NSDI in the UK – Quo Vadis”. Proceedings
of the FIG Working Week 2000, Prague, Czech Republic
http://www.fig.net/pub/proceedings/prague-final-papers/mclaren.htm.
- McLaren R.A., Coleman D., Mayunga S., 2005. “Sustainable Management of
Mega Growth in Megacities”. Proceedings of the FIG Working Week, Cairo,
Egypt,
http://www.fig.net/pub/cairo/papers/ts_19/ts19_01_mclaren_etal.pdf.
- Mega V., 1990. “Topography and Development of Ancient City-States in
Greece”. Journal Arxaiologia,
http://www.arxaiologia.gr/assets/media/PDF/migrated/588.pdf (in Greek).
- Mena J.B., 2003. “State of the Art on Automatic Road Extraction for GIS
Update: A Novel Classification”. Pattern Recogn. Lett., 24: 3037–3058.
- Moeller M.S., Blaschke T., 2006. “Urban Change Extraction from High
Resolution Satellite Image”. International Archives of the Photogrammetry,
Remote Sensing and Spatial Information Sciences, Vienna, Austria, XXXVI(2):
151–156.
- Morgan M., Habib A., 2002. “Interpolation of LiDAR Data and Automatic
Building Extraction”. Proceedings of the 2002 ACSM Annual Conference.
- Nebert D.D. (Ed.), 2004. “The SDI Cookbook – Developing Spatial Data
Infrastructures”, Version 2.0, GSDI – Global Spatial Data Infrastructure,
http://gsdi.org/docs2004/Cookbook/cookbookV2.0.pdf.
- Neiling M., Lenz H.J., 2000. ”Data Fusion and Object Identification”.
Proceedings of the SS-GRR2000.
- Nixon M., Aguado A.S., 2002. “Feature Eextraction and Image Processing”,
Newenes, England. pp. 220–243.
- Oda K., Takano T., Doihara T., Shibaski R., 2004. ”Automatic Building
Extraction and 3-D City Modeling from LiDAR Data Based on Hough Transform”.
International Archives of Photogrammetry and Remote Sensing, 35(B3):277–281.
- Oriot H., 2003. “Statistical Snakes for Building Extraction from
Stereoscopic Aerial Images”. International Archives of the Photogrammetry,
Remote Sensing and Spatial Information Sciences, Munich, Germany,
XXXIV(3/W8): 65–70.
- Oriot H., Michel A., 2004. “Building Extraction from Stereoscopic Aerial
Images”. Applied Optics, 43(2): 218–226.
- Osei A., Merem E., Twumasi Y., 2006. “The Applications of Geospatial
Information Technology in Land Management: A Case Study of Lagos, Nigeria”.
Proceedings of the GSDI-9 Conference, Santiago, Chile, unpaginated CD-ROM.
- Parent C., Spaccapietra, S., 2000. “Database Integration: The Key to
Data Interoperability”. Advances in Object-Oriented data modeling (MIT
Press).
- Pesaresi M., Benediktsson J.A., 2001. “A New Approach for the
Morphological Segmentation of High-Resolution Satellite Imagery”. IEEE
Transaction on Geoscience and Remote Sensing, 39(2): 309–320.
- Potsiou C., 2008. “Unplanned Urban Development and the Need for Good
Spatial Information Infrastructure”. Proceedings of the FIG Commission 3
Workshop on ‘Spatial Information Management toward Environmental Management
of Mega Cities’, Valencia, Spain, unpaginated CD-ROM.
- Potsiou C., 2009. “Tools for Legal Integration and Provision of
Environmental Improvements in Informal Settlements in Europe – A case study
from Albania and Greece”. Global Land Tool Network, UN HABITAT, (to be
published).
- Potsiou C., Ioannidis C., 2006. “Informal Settlements in Greece: The
Mystery of Missing Information and the Difficulty of Their Integration into
A Legal Framework”. Proceedings of the 5th FIG Regional Conference, Accra,
Ghana,
http://www.fig.net/pub/accra/papers/ts03/ts03_04_potsiou_ioannidis.pdf.
- Pratt W.K., 2001. “Digital Image Processing”, 3rd edition. John Wiley &
Sons Inc., New York, USA, pp. 289–294.
- Psaltis C., Ioannidis C., 2010. “Supervised Change Detection on
Simulated Data employing Support Vector Machines”, Proceedings of the FIG
Congress 2010, Sydney, Australia,
http://www.fig.net/pub/fig2010
- Pu S., Vosselman G., 2009. “Building Facade Reconstruction by Fusing
Terrestrial Laser Points and Images”. Sensors, 9: 4525–4542.
- Puntodewo, Nataprawira R., 2004. “Indonesian Geospatial Data
Clearinghouse”, Proceedings of the 3rd FIG Regional Conference, Jakarta,
Indonesia,
http://www.fig.net/pub/jakarta/papers/ts_02/ts_02_2_puntodewo_nataprawira.pdf.
- Rad A. E., Sarpoulaki M., 2004. ”Islamic Republic of Iran National
Report for Photogrammetry and Remote Sensing 2000–2004”. Proceedings of the
ISPRS Congress, Commission VI, Istanbul, Turkey.
- Radoczky V., 2007. “How to Design a Pedestrian Navigation System for
Indoor and Outdoor Environments”, Location Based Services and
TeleCartography, Springer, Berlin, ISBN 978-3-540-87392-1.
- Ramírez J.O., 2005. “The Spatial Data Infrastructure of México
‘IDEMex’”. Proceedings of the FIG Working Week 2005 and GSDI-8, Cairo,
Egypt,
http://www.fig.net/pub/cairo/papers/ts_31/ts31_05_olvera.pdf.
- Rau J.Y., Chen L.C., 2003. „Robust Reconstruction of Building Models
from Three Dimensional Line Segments“. Photogrammetric Engineering & Remote
Sensing, 69(2): 181–188.
- Rottensteiner F., 2006. „Consistent Estimation of Building Parameters
Considering Geometric Regularities by Soft Constraints“. International
Archives of the Photogrammetry, Remote Sensing and Spatial Information
Sciences, 36(3):13–18.
- Rottensteiner F., Trinder J., Clode S., Kubik K., 2005. „Automated
Delineation of Roof Planes from LIDAR Data“. International Archives of the
Photogrammetry, Remote Sensing and Spatial Information Sciences,
36(3/W19):221–226.
- Ruther H., Martine H., Mtalo E,G., 2002. “Application of Snakes and
Dynamic Programming Optimisation Technique in Modeling of Buildings in
Informal Settlement Areas”. ISPRS Journal of Photogrammetry & Remote
Sensing, 56(4): 269–282.
- Saalfeld A., 1988. “Conflation-Automated Map Compilation”. International
Journal of Geographical Information Science (IJGIS), 2: 217–228.
- Safra E., 2008. “Object Fusion in Geographic Information Systems”, a PhD
dissertation, Technion, Israel Institute of Technology.
- Samal A., Seth S., Cueto K., 2004. “A Feature Based Approach to
Conflation of Geospatial Sources”. International Journal of Geographical
Information Science (IJGIS), 18: 459–489.
- Schwalbe E., 2004. “3D Building Model Generation from Airborne
Laserscanner Data by Straight-Line Detection in Specific Orthogonal
Projections”. International Archives of Photogrammetry and Remote Sensing,
35(3):249–254.
- Sester M., 2009. “The Potential of Geosensor Networks for Sustainable
Management of Urban Areas”. Proceedings of the FIG Com3 Workshop on Spatial
Information for Sustainable Management of Urban Areas, Mainz, Germany.
- Shackelford A.K., Davis C.H., Wang X., 2004. “Automatic 2-D Building
Footprint Extraction from High-Resolution Satellite Multispectral Imagery”,
Proceedings of the International Geoscience and Remote Sensing Symposium,
Anchorage, Alaska, 3: 1996–1999.
- Shapira A., 2009. “On Earthquake Preparedness in Israel”. Proceedings of
the FIG Working Week, Eilat, Israel,
http://www.fig.net/pub/fig2009/ppt/ps02/ps02_shapira_ppt_3508.pdf.
- Shragai Z., Barnea S., Filin S., Zalmanson G., Doytsher Y., 2005.
“Automatic Image Sequence Registration Based on a Linear Solution and Scale
Invariant Keypoint Matching”, BenCOS – ISPRS Workshop in conjunction with
ICCV 2005 on ‘Towards Benchmarking Automated Calibration, Orientation and
Surface Reconstruction from Images’, Beijing, China, International Archives
of Photogrammetry and Remote Sensing. 36(3/W36): 5–11.
- Sithole G., Vosselman G., 2004. “Experimental Comparison of Filter
Algorithms for Bare Earth Extraction from Airborne Laser Scanning Point
Clouds”. ISPRS Journal of Photogrammetry and Remote Sensing, 59(1–2):
85–101.
- Steven A.R., 2005. “The US National Spatial Data Infrastructure: What is
new?”, Proceedings of the ISPRS Workshop on Service and Application of
Spatial Data Infrastructure, Hangzhou, China, XXXVI(4/W6).
- Strande K., 2009. “Spatial Data Infrastructure as Tools in Environment
and Geohazard Management Examples from Norway”. Proceedings of the 7th FIG
Regional Conference, Hanoi, Vietnam,
http://www.fig.net/pub/vietnam/papers/ts01d/ts01d_strande_3595.pdf.
- Straub B.M., Wiedemann C., Heipke C., 2000. „Towards Automatic
Interpretation of Images for GIS Update“. International Archives of the
Photogrammetry, Remote Sensing and Spatial Information Sciences, Amsterdam,
Netherlands, XXXIII(B2): 525–532.
- Tang T., Zhao J., Coleman D.J., 2005. «Design of a GIS-Enabled Online
Discussion Forum for Participatory Planning». Proceedings of the 4th Annual
Public Participation GIS Conference, Cleveland State University, Cleveland,
Ohio, USA. The Macaulay Institute, 2006. “The Newsletter of The Macaulay
Institute”, Spring 2006,
http://www.macaulay.ac.uk/planning.
- Tovari D., Pfeifer N., 2005. “Segmentation Based Robust Interpolation –
A New Approach to Laser Data Filtering”. International Archives of the
Photogrammetry, Remote Sensing and Spatial Information Sciences, Enschede,
Netherlands, XXXVI(3/W19): 79–84.
- Trimi S., Sheng H., 2008. “Emerging Trends in M-Government”.
Communications of the ACM, 51(5): 53–58.
- Tsenkova S., Potsiou C., Badyina A., 2009. “Self-Made Cities – In Search
of Sustainable Solutions for Informal Settlements in the United Nations
Economic Commissions for Europe region”. United Nations Economic Commission
for Europe (UNECE), United Nations Publications, ISBN 978-92-1-117005-4,
Geneva, p. 113.
- Voegtle T., Steinlle E., Tovari D., 2005. “Airborne Laserscanning Data
for Determination of Suitable Areas for Photovoltaics”. International
Archives of the Photogrammetry, Remote Sensing and Spatial Information
Sciences, 36(3/W19):215–220.
- Vosselman G., Dijkaman S., 2001. “3D Building Model Reconstruction from
Point Clouds and Ground Plans”. International Archives of Photogrammetry and
Remote Sensing, 34(3/W4).
- UN-Habitat, 2006. “State of the World’s Cities 2006/7”, UN-Habitat,
Nairobi. ISBN 92/1/131811-4,
http://www.unhabitat.org/pmss/getPage.asp?page=bookView&book=2101.
- United Nations Population Division, 2006. „World Urbanisation Prospects:
The 2005 Revision“, New York.
- Walter V., 2004. “Object-Based Classification of Remote Sensing Data for
Change Detection”, ISPRS Journal of Photogrammetry & Remote Sensing,
58(3–4): 225–238.
- Wang Z., 1998. “Extracting Building Information from LIDAR Data”.
International Archives of Photogrammetry and Remote Sensing,
32(3/1):279–284.
- Weiser M., 1991. “The Computer for the Twenty-First Century”, Scientific
American, Vol. 94.
- Wiederhold G., 1999. “Mediation to Deal with Heterogeneous Data
Sources”. Proceedings of the Interoperating Geographic Information Systems,
pp. 1–16.
- Wilbanks T.J., Romero Lankao P., Bao M., Berkhout F., Cairncross S.,
Ceron J.P., Kapshe M., Muir-Wood R., Zapata-Marti R., 2007. “Industry,
Settlement and Society”. Climate Change 2007: Impacts, Adaptation and
Vulnerability. Contribution of Working Group II to the Fourth Assessment
Report of the Intergovernmental Panel on Climate Change, Cambridge
University Press, Cambridge, UK, 357–390.
- Williamson I., Rajabifard A., Binns, 2006. “The Role of Spatial Data
Infrastructures in Establishing an Enabling Platform for Decision Making in
Australia”. Proceedings of the GSDI-9 Conference, Santiago, Chile.
- World Bank, 2009. “World Development Report 2009, Reshaping Economic
Geography”, The International Bank for Reconstruction and Development / The
World Bank, ISBN 978-0-8213-7607-2.
- Zhao J., Coleman D.J., 2006. “GeoDF: Towards a SDI-based PPGIS
Application for E-Governance”. Proceedings of the GSDI 9 Conference,
Santiago, Chile,
http://www.gsdi9.cl/english/papers/TS9.3paper.pdf.
- Zhilin L., Qing Z., Qung Z., and Gold C., 2005. “Digital Terrain
Modeling – Principles and Methodology”, CRC Press, ISBN-13 9780415324625.
- Zhu Y., Yang C., Wong D.W., Kafatos M., 2005. “A Distributed GIS for
Managing Shanghai Landscape Resources”. International Journal of Geographic
Information Sciences, 11(1).
- Zimmermann P., 2000. “A New Framework for Automatic Building Detection
Analysing Multiple Cue Data”. International Archives of the Photogrammetry,
Remote Sensing and Spatial Information Sciences, Amsterdam, Netherlands,
XXXIII(B3): 1063–1070.
List of SDI Websites
Copyright © International Federation of Surveyors
All rights reserved
The International Federation of Surveyors (FIG)
Kalvebod Brygge 31–33, DK-1780 Copenhagen V
DENMARK
Tel. +45 38 86 10 81
Fax +45 38 86 02 52
E-mail: FIG@FIG.net
www.fig.net
Published in English
Copenhagen, Denmark
ISBN 978-87-90907-78-5
Published by
The International Federation of Surveyors (FIG)
January 2010
ACKNOWLEDGEMENTS
Editor: Chryssy Potsiou
Cover photos © Stig Enemark
Design and layout: International Federation of Surveyors, FIG
Printer: Oriveden Kirjapaino, Finland
|


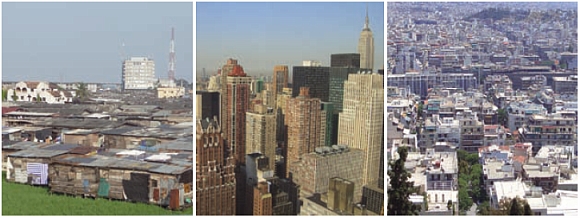